Kumpulan Soal IELTS Writing Terlengkap (Task 1)
titiknolenglish.com (Kumpulan Soal IELTS Writing Terlengkap Task 1) – Hai TNers! Jika kita berbicara tentang tes IELTS, maka yang ada dipikiran kita adalah: tes Writing, Listening, Reading, dan Speaking. Dan kebanyakan dari kita menjadikan tes Writing adalah tes yang sedikit menakutkan (Minol merasa seperti itu juga sih hehe).
Lalu apa yang harus kita lakukan dong? Minol biasanya berlatih terus dengan mengerjakan latihan-latihan soal dari tes writing tersebut. Tapi bagaimana kita bisa mendapatkan contoh-contoh soalnya? Tenang aja! Kali ini Minol berhasil merangkum kumpulan soal IELTS Writing terlengkap task 1 dan task 2.
Pasti kalian sudah gak sabar kan? Informasi ini Minol beri judul: Kumpulan Soal IELTS Writing Terlengkap. Tapi kumpulan soal IELTS Writing ini Minol bagi menjadi Kumpulan soal IELTS Writing Task 1 dan Task 2 (di artikel selanjutnya). So, langsung saja kita intip sama-sama dan pastikan kamu simak ulasannya sampai habis yak!
Baca juga: Tips Lengkap Belajar IELTS
Kumpulan Soal IELTS Writing Terlengkap (Task 1)
Soal-soal IELTS Writing Task 1 – Graphs, Charts, Maps, & Processes
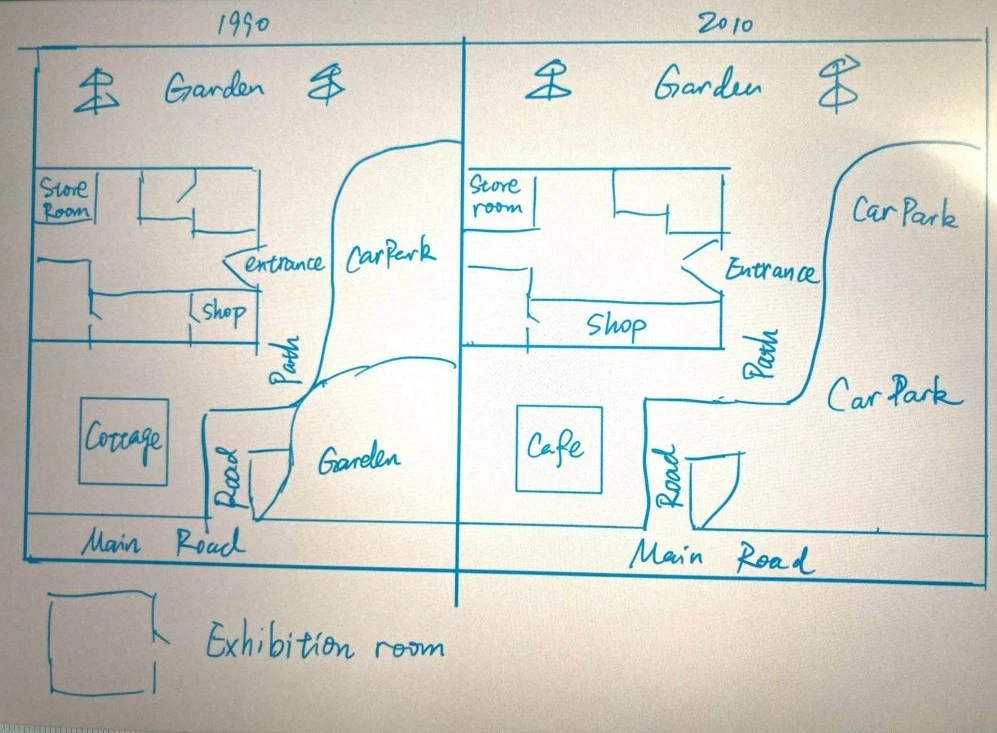
Soal IELTS Writing Task 1: Map of a Museum in 1990-2010
The diagrams show a museum and its surroundings in 1990 and 2010. Summarise the information by selecting and reporting the main features, and make comparisons where relevant.
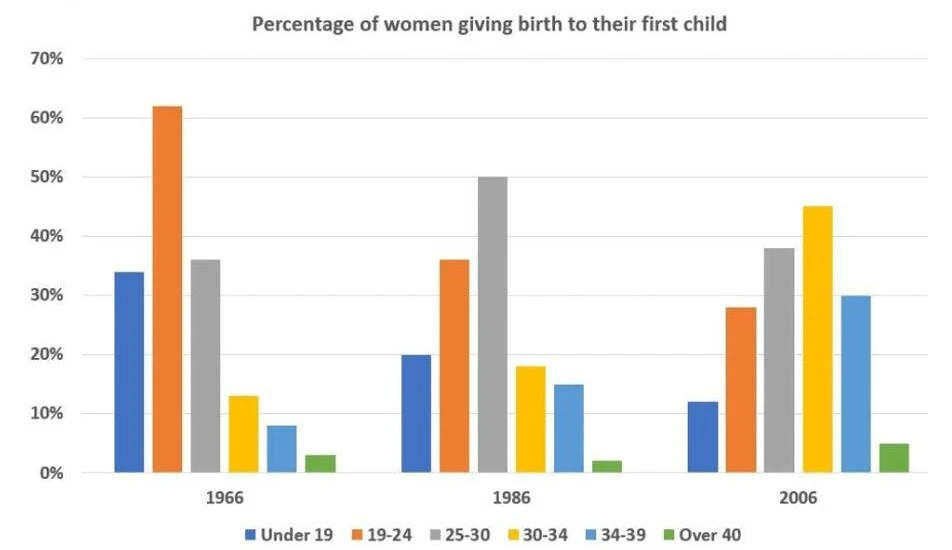
Soal IELTS Writing Task 1: Women in Australia – First Child
The chart below gives information about the age of women in Australia when they gave birth to their first child in 1966, 1986 and 2006. Summarise the information by selecting and reporting the main features and make comparisons where relevant.
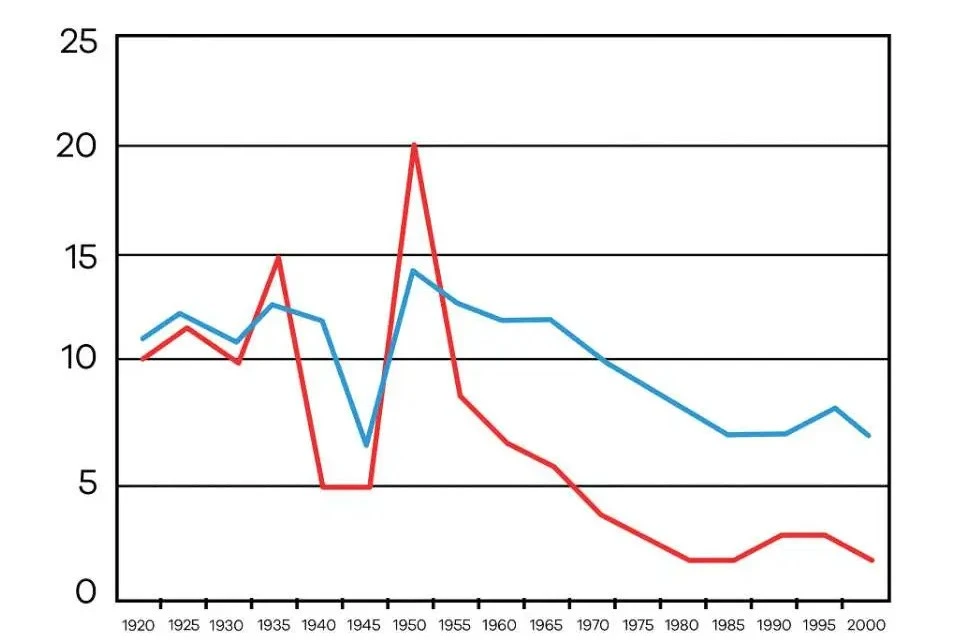
Soal IELTS Writing Task 1: Birth Rates China and The USA
The graph below compares changes in the birth rates of China and the USA between 1920-2000. Summarise the information by selecting and reporting the main features, and make comparisons where relevant.
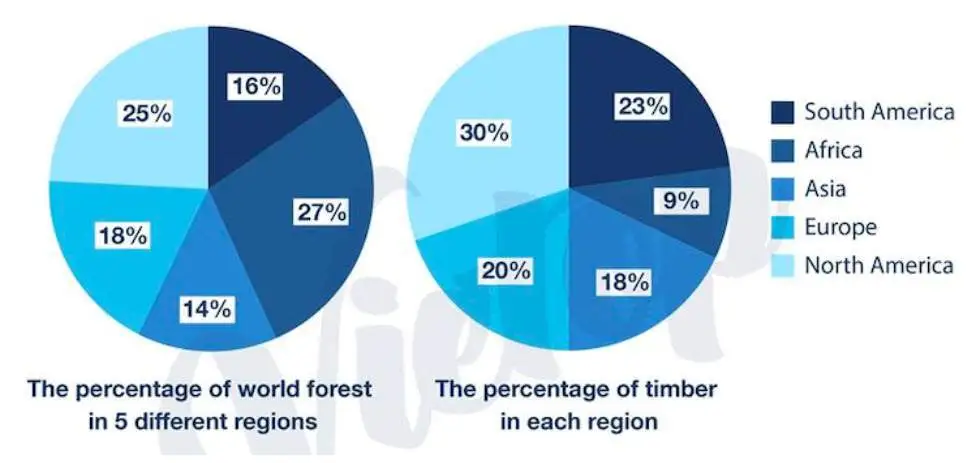
Soal IELTS Writing Task 1: The World’s Forest
The pie charts give information about the world’s forest in five different regions.
Summarize the information by selecting and reporting the main features, and make comparisons where relevant.
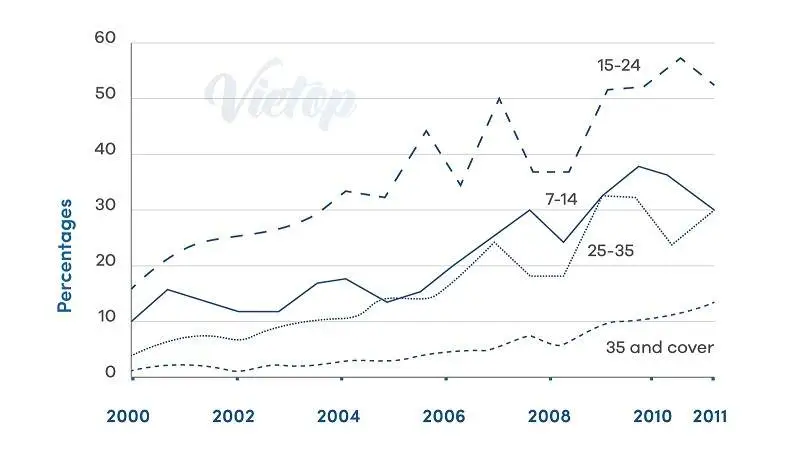
Soal IELTS Writing Task 1: Age Groups and Cinema Attendance
The line chart shows average attendance at the cinema among various age groups in the US from 2000 to 2011. Summarise the information by selecting and reporting the main features, and make comparisons where relevant.
Baca juga: Semua Yang Perlu Kamu Tahu Tentang IELTS
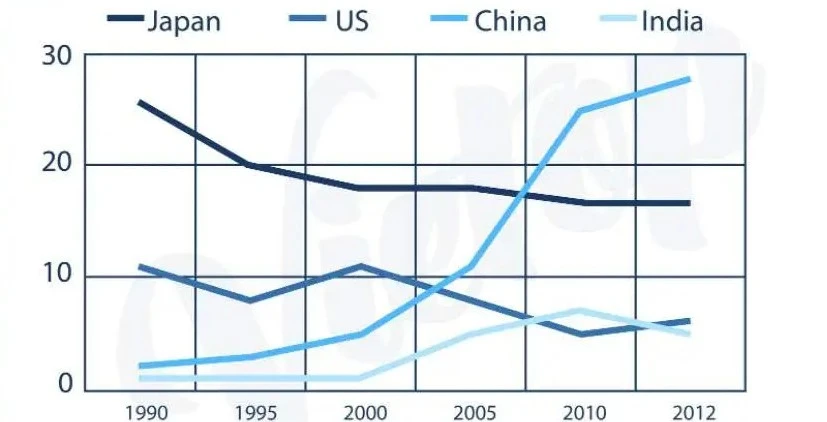
Soal IELTS Writing Task 1: Australian Exports
The graph below shows that the percentage of Australian export to 4 countries from 1990 to 2012. The line chart shows exports in billions of dollars. Summarise the information by selecting and reporting the main features, and make comparisons where relevant.
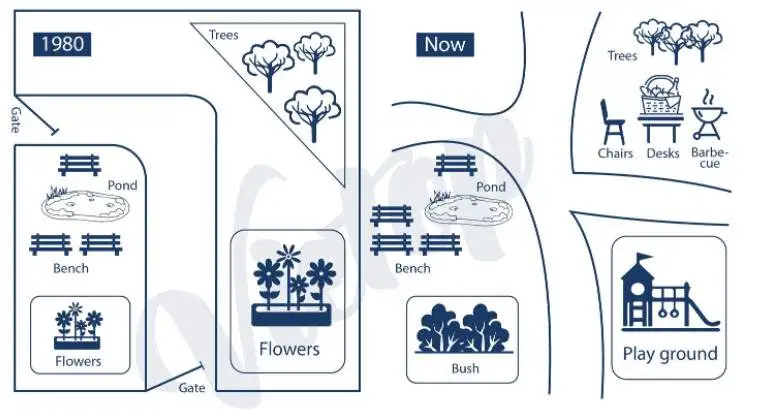
Soal IELTS Writing Task 1: Map of a Park
The map below describes changes to a park in 1980 and now. Summarise the information by selecting and reporting the main features, and make comparisons where relevant.
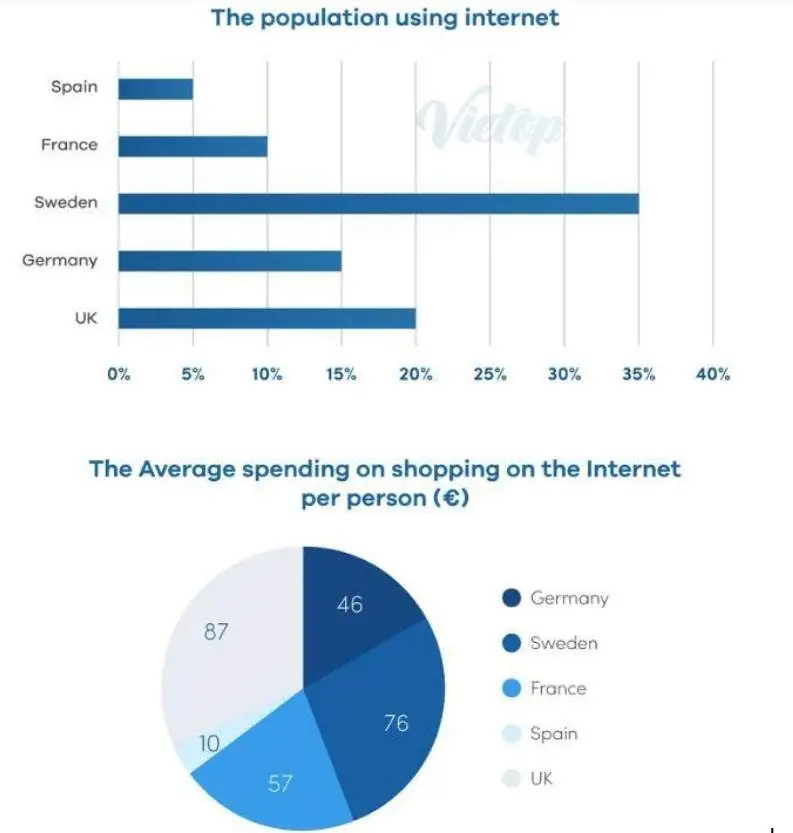
Soal IELTS Writing Task 1: Internet Use
Summarise the information by selecting and reporting the main features, and make comparisons where relevant.
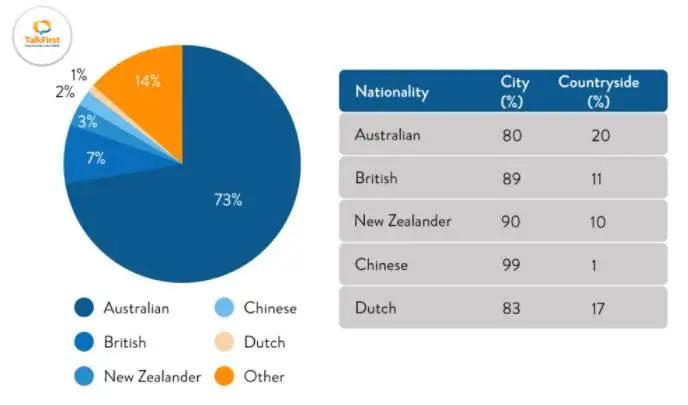
Soal IELTS Writing Task 1: Combined Pie Chart and Table
The table and pie chart illustrate populations in Australia according to different nationalities and areas. Summarize the information by selecting and reporting the main features and make comparisons where relevant.
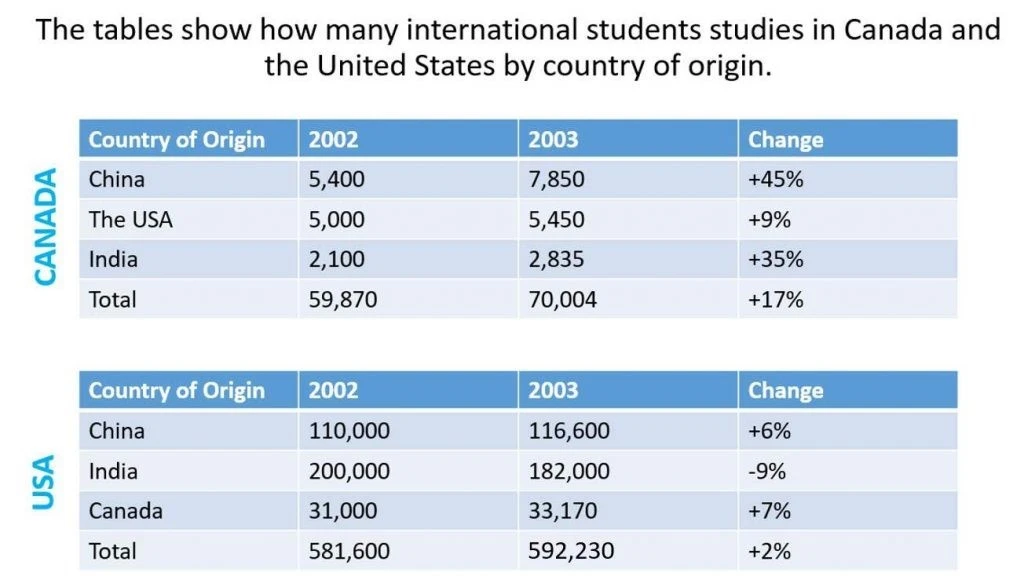
Soal IELTS Writing Task 1: International Students in Canada and the USA
Summarise the information by selecting and reporting the main features, and make comparisons where relevant.
Baca juga: Contoh Pertanyaan IELTS Speaking Part 1
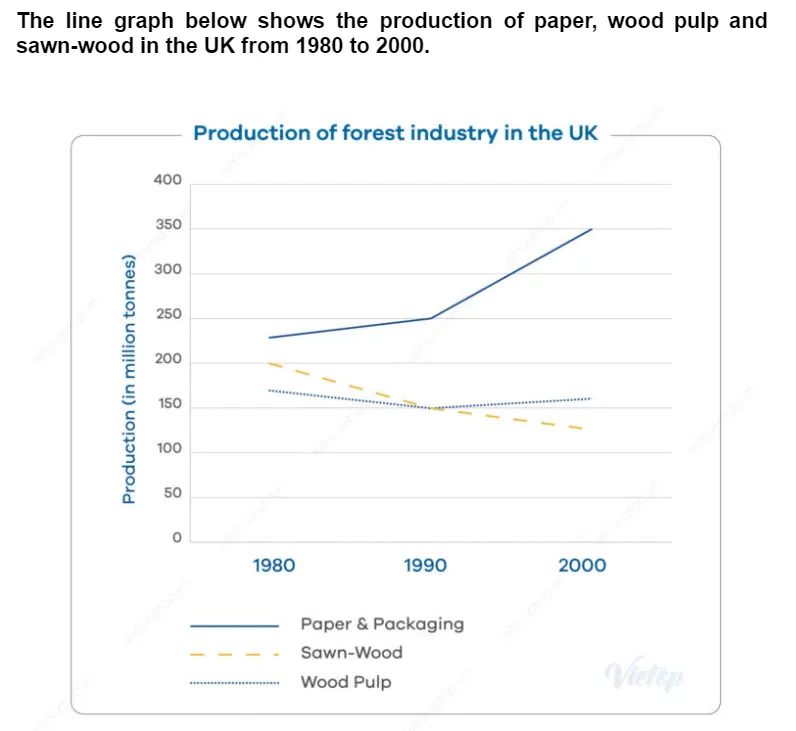
Soal IELTS Writing Task 1: Forest Industry Production
Summarise the information by selecting and reporting the main features, and make comparisons where relevant.
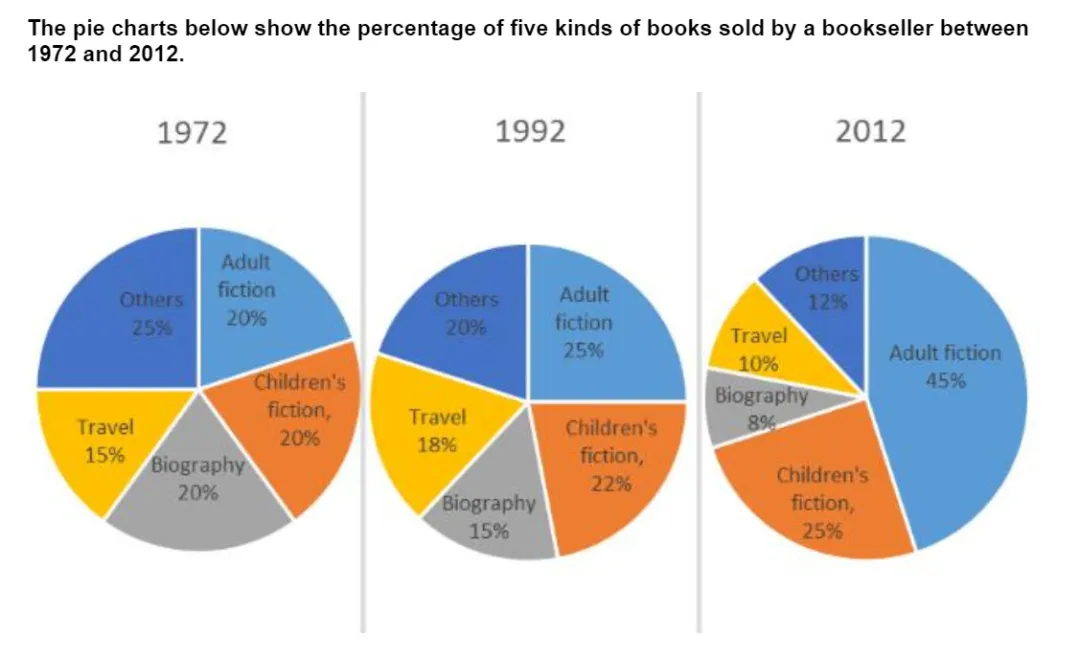
Soal IELTS Writing Task 1: Bookseller Pie Charts
Summarise the information by selecting and reporting the main features, and make comparisons where relevant.
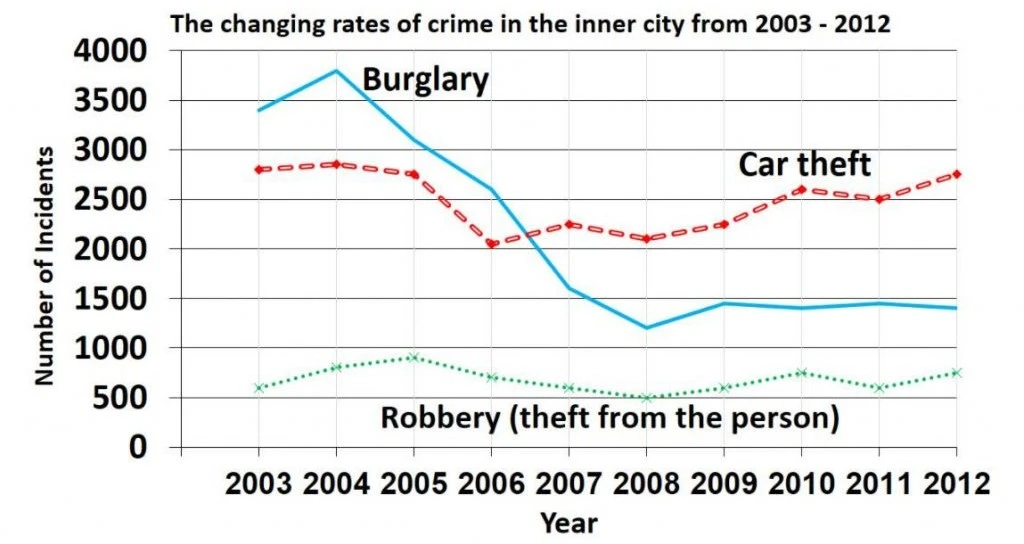
Soal IELTS Writing Task 1: Crime in the City Center Line Chart
The chart below show the changes that took place in three different areas of crime in New Port city center from 2003 to 2012. Summarise the information by selecting and reporting the main features, and make comparisons where relevant.
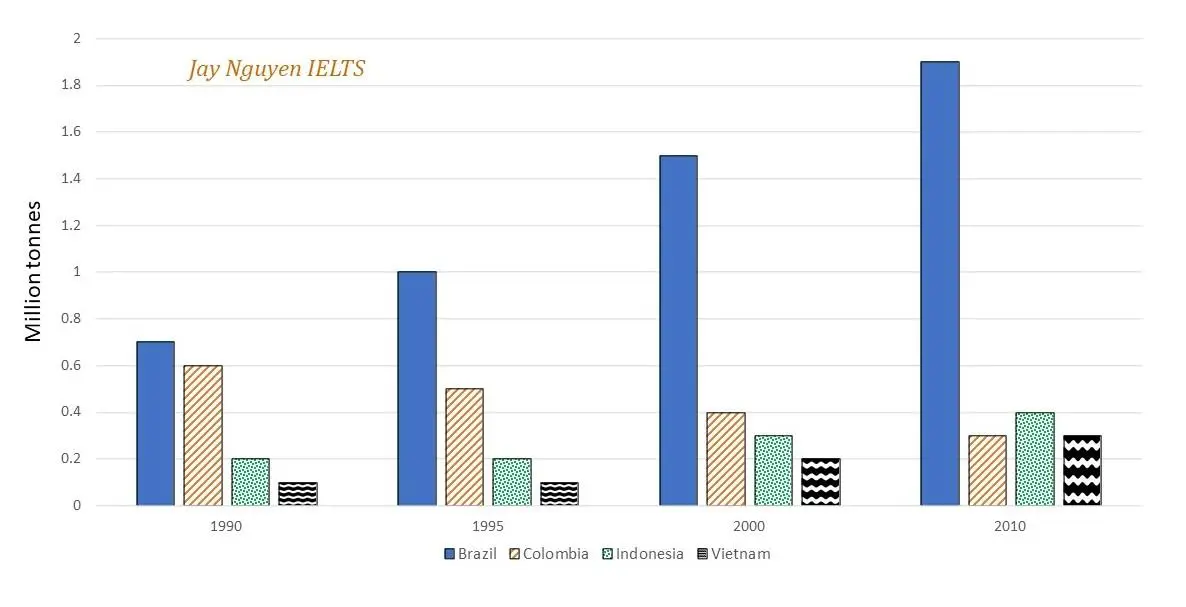
Soal IELTS Writing Task 1: Coffee Production Bar Chart
Summarise the information by selecting and reporting the main features, and make comparisons where relevant.
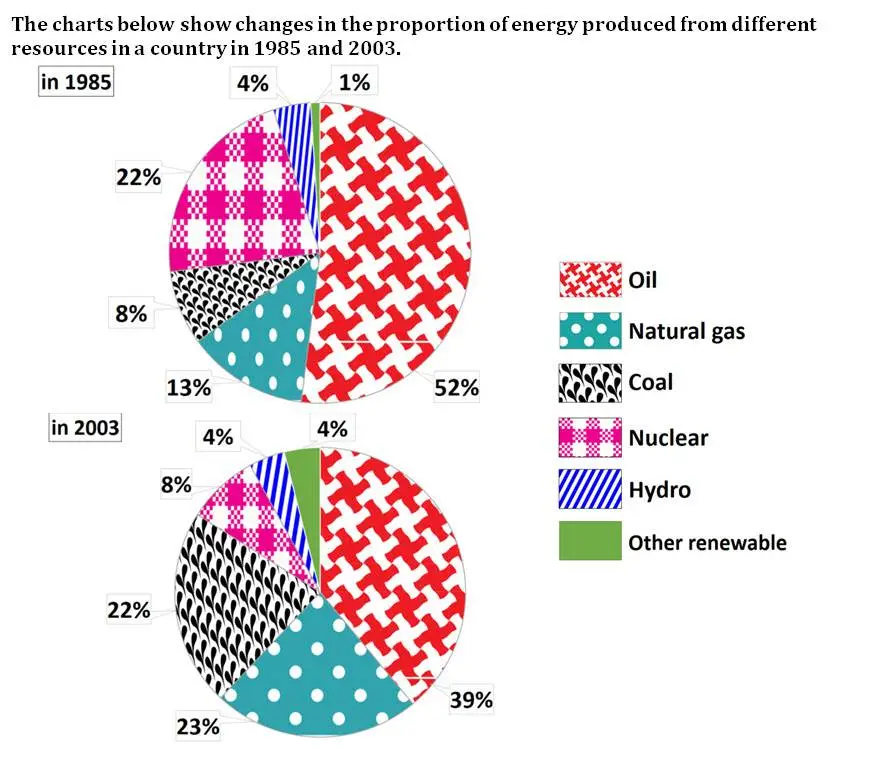
Soal IELTS Writing Task 1: Pie Charts Energy
Summarise the information by selecting and reporting the main features, and make comparisons where relevant.
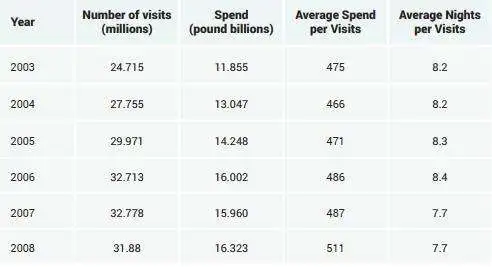
Soal IELTS Writing Task 1: Visitors to the UK Spending Table
The table below shows the number of visitors in the UK and their average spending from 2003 to 2008. Summarise the information by selecting and reporting the main features, and make comparisons where relevant.
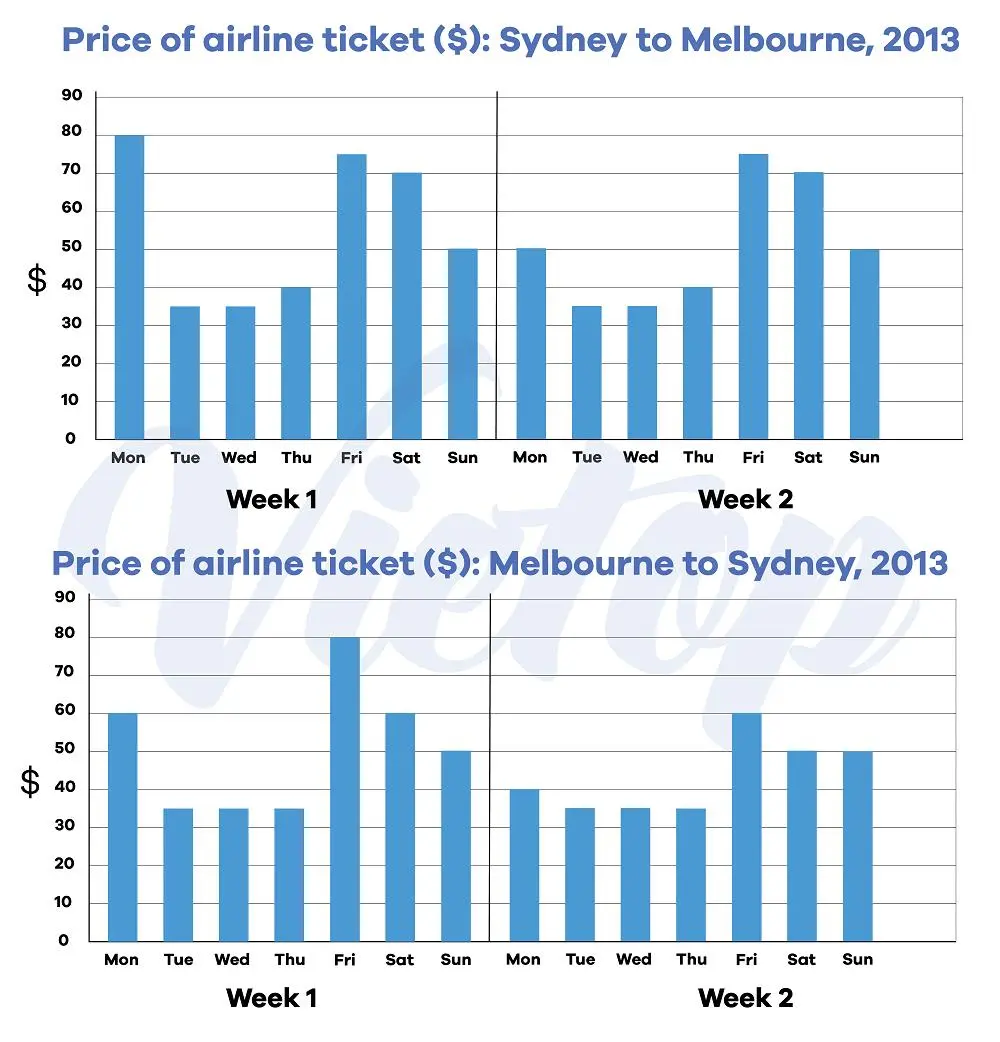
Soal IELTS Writing Task 1: Airline Ticket Prices
The charts below give information about the price of tickets on one airline between Sydney and Melbourne, Australia, over a two-week period in 2013. Summarise the information by selecting and reporting the main features, and make comparisons where relevant.
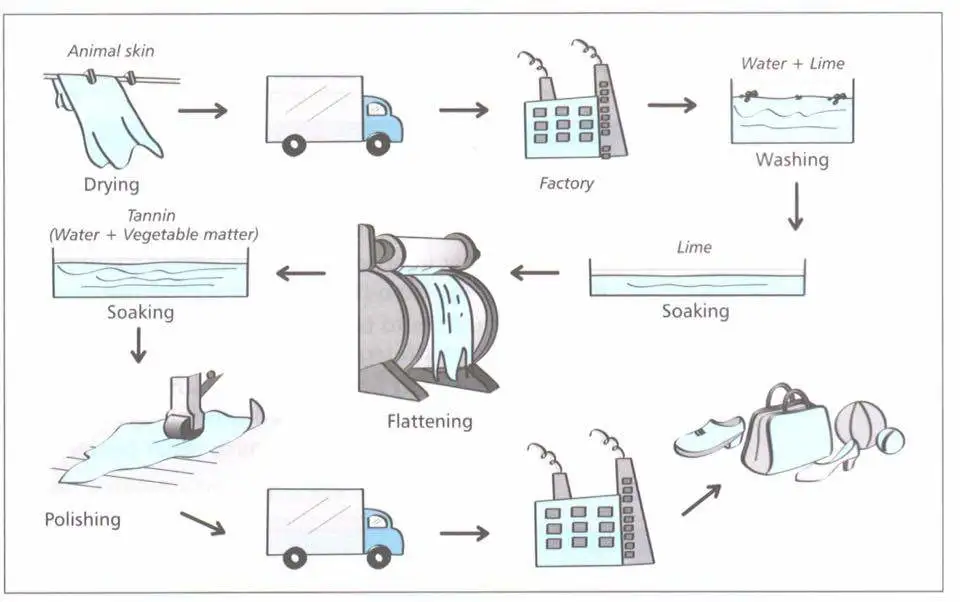
Soal IELTS Writing Task 1: Leather Process
The diagram details the process of making leather products.
Summarise the information by selecting and reporting the main features, and make comparisons where relevant.
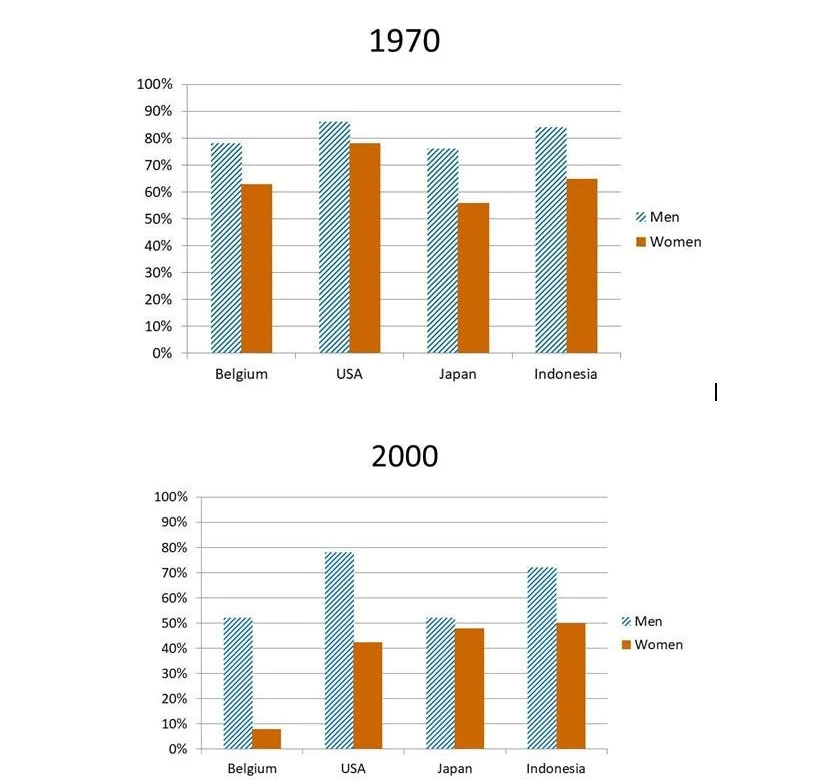
Soal IELTS Writing Task 1: Employment for Men and Women
The charts show information about percentage of men and women aged 60-64 who were employed in four countries in 1970-2000. Summarise the information by selecting and reporting the main features, and make comparisons where relevant.
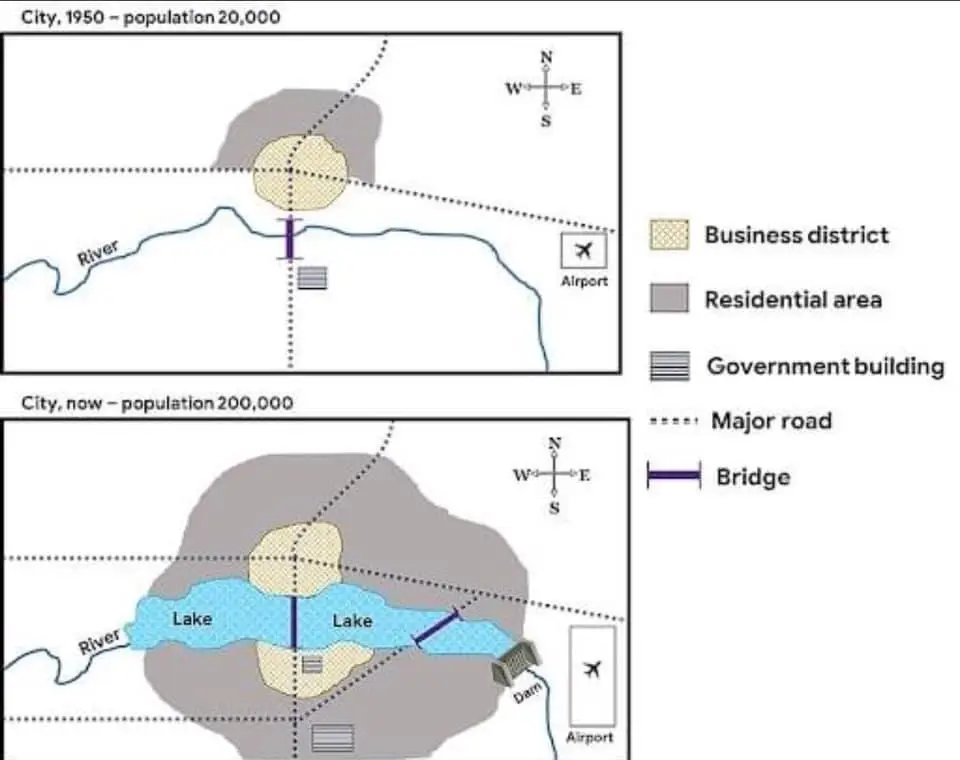
Soal IELTS Writing Task 1: Map of a City in 1950
Summarise the information by selecting and reporting the main features, and make comparisons where relevant.
Baca juga: Tips Mengerjakan IELTS Writing Task 1
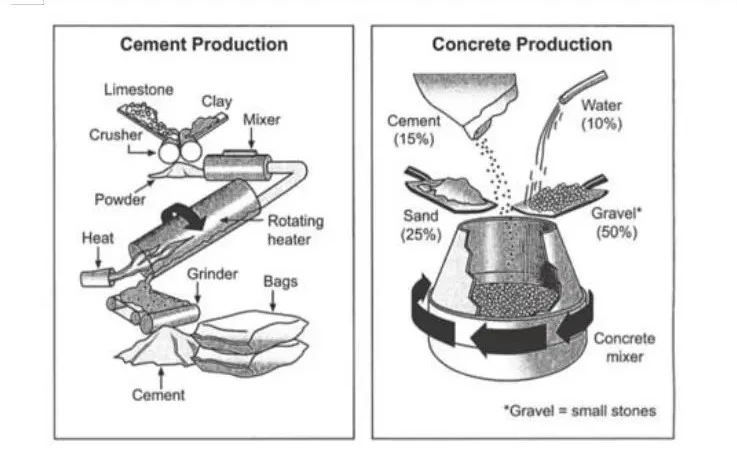
Soal IELTS Writing Task 1: Cement and Concrete Production Process
The diagrams below show the stages and equipment used in the cement-making process, and how cement is used to produce concrete for building purposes. Summarise the information by selecting and reporting the main features, and make comparisons where relevant.
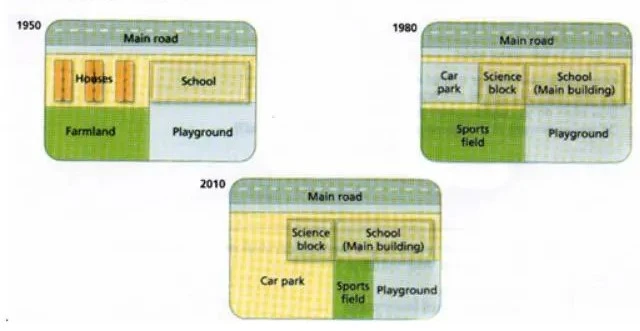
Soal IELTS Writing Task 1: Map West Park Secondary School
You should spend about 20 minutes on this task.
The diagrams below show the changes that have taken place at West Park Secondary School since its construction in 1950.
Summarise the information by selecting and reporting the main features and make comparisons where relevant.
Write at least 150 words.
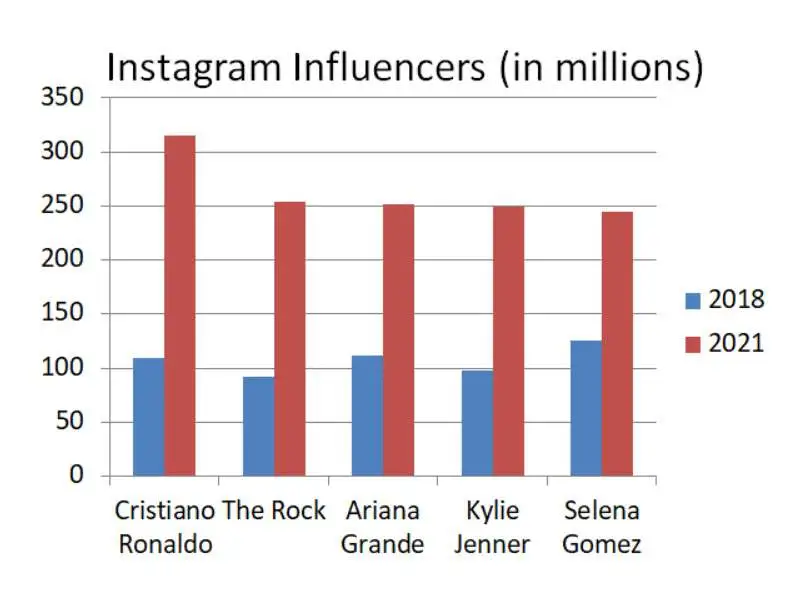
Soal IELTS Writing Task 1: Influencers Bar Chart
Summarise the information by selecting and reporting the main features, and make comparisons where relevant.
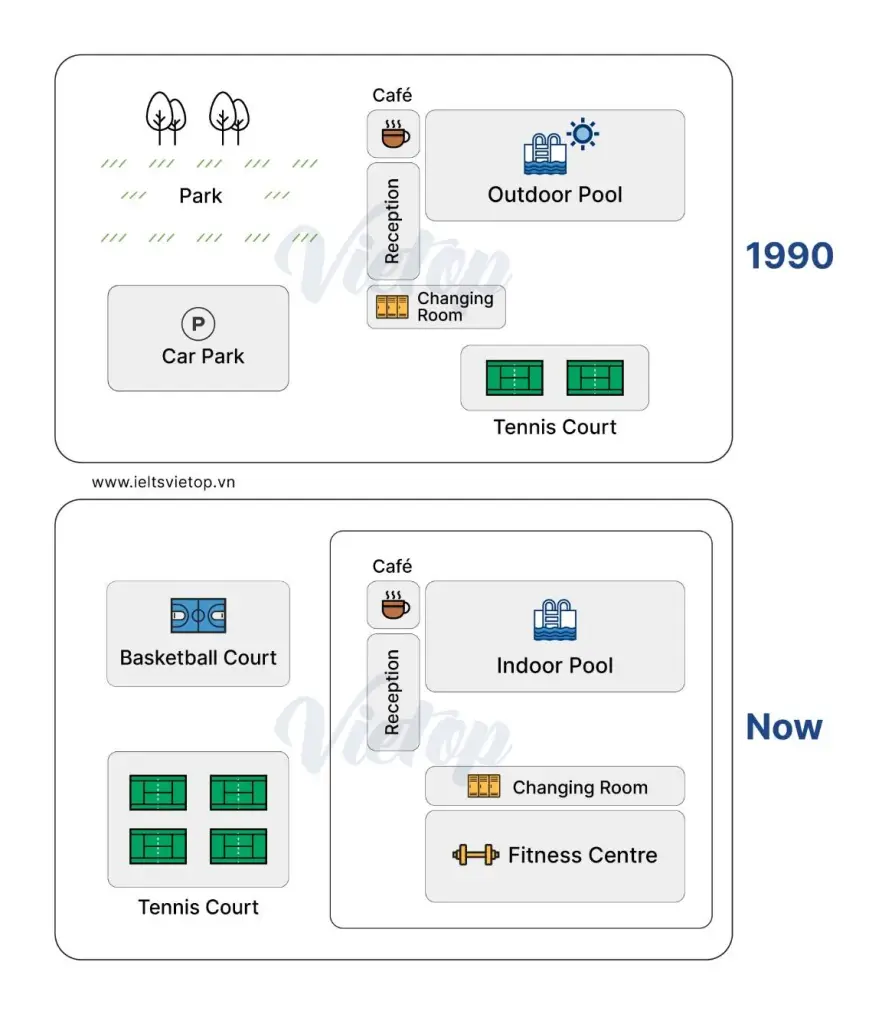
Soal IELTS Writing Task 1: University Sports Courts
The maps below shows university sports courts in 1990 and now.
Summarise the information by selecting and reporting the main features, and make comparisons where relevant.
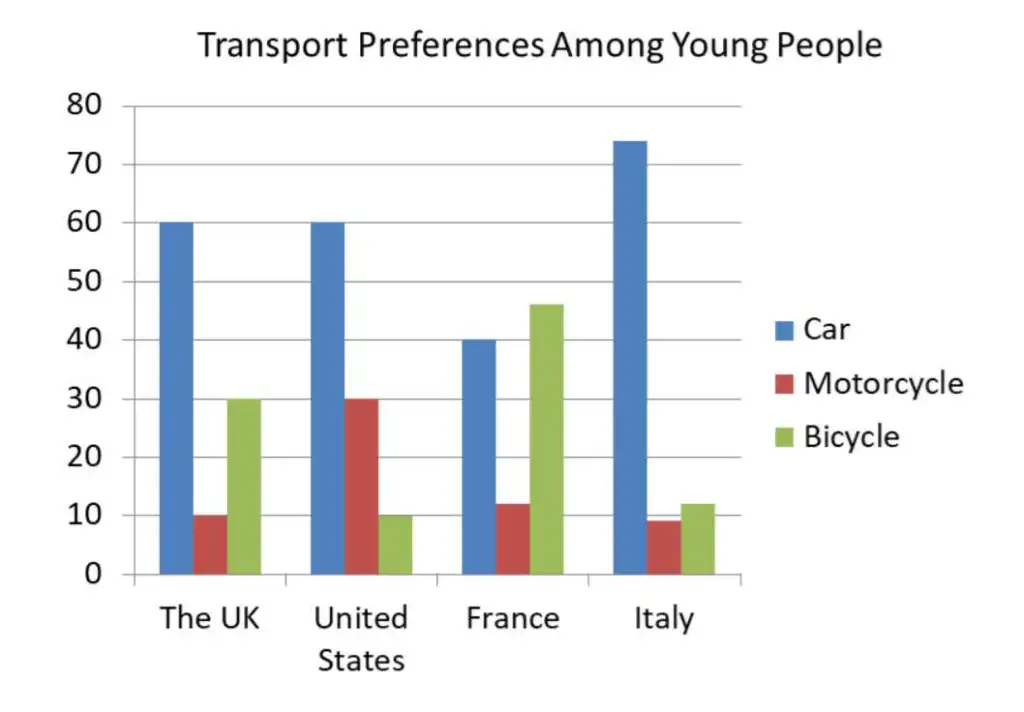
Soal IELTS Writing Task 1: Transport Preferences Among Young People
The bar chart below shows transport preferences among young people in four countries in a single year.
Summarise the information by selecting and reporting the main features, and make comparisons where relevant.
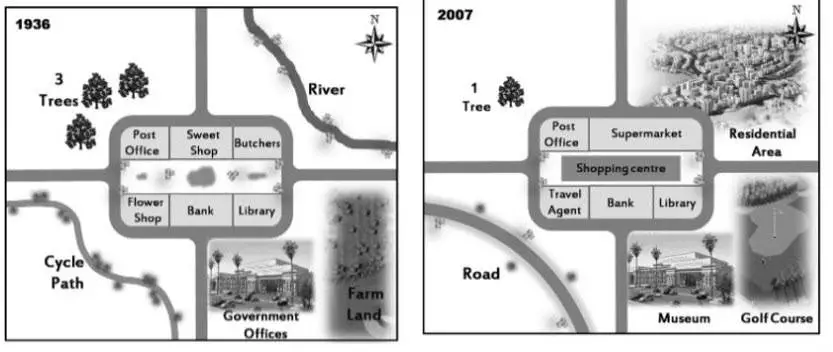
Soal IELTS Writing Task 1: Map of the Town of Lynnfield
The maps below shows the town of Lynnfield in 1936 and then later in 2007.
Summarise the information by selecting and reporting the main features, and make comparisons where relevant.
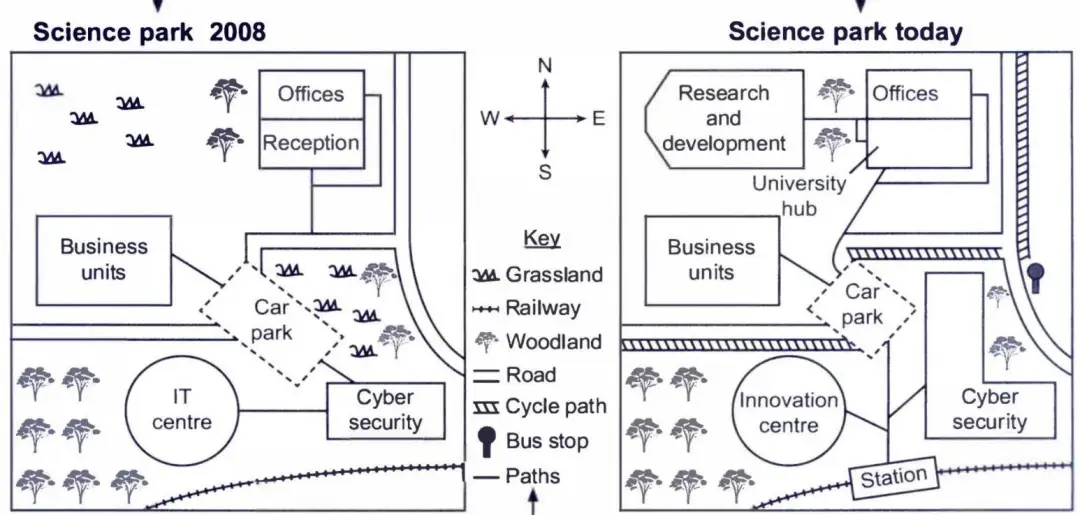
Soal IELTS Writing Task 1: Science Park Map
The maps below show a science park in 2008 and the same park today.
Summarise the information by selecting and reporting the main features, and make comparisons where relevant.
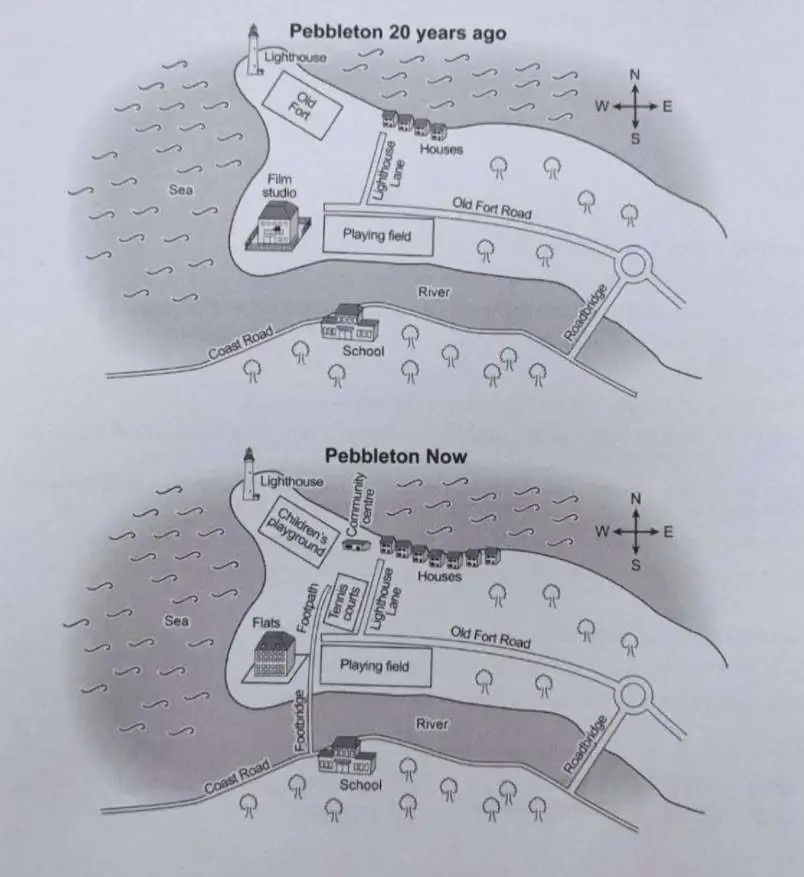
Soal IELTS Writing Task 1: Map of Pebbleton
The maps below show Pebbleton 20 years ago and today.
Summarise the information by selecting and reporting the main features, and make comparisons where relevant.
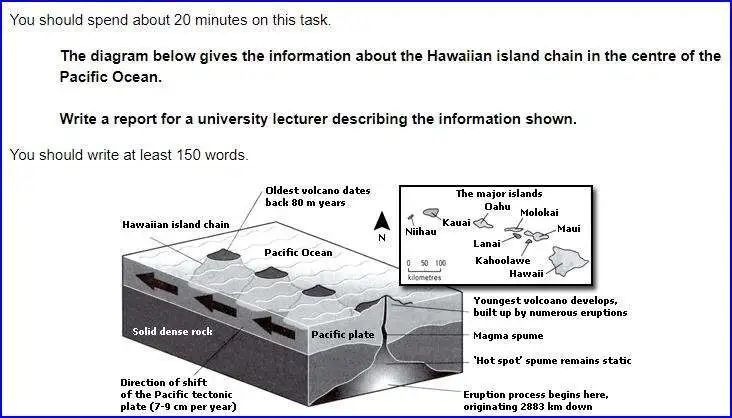
Soal IELTS Writing Task 1: Volcanic Island Chain in Hawaii
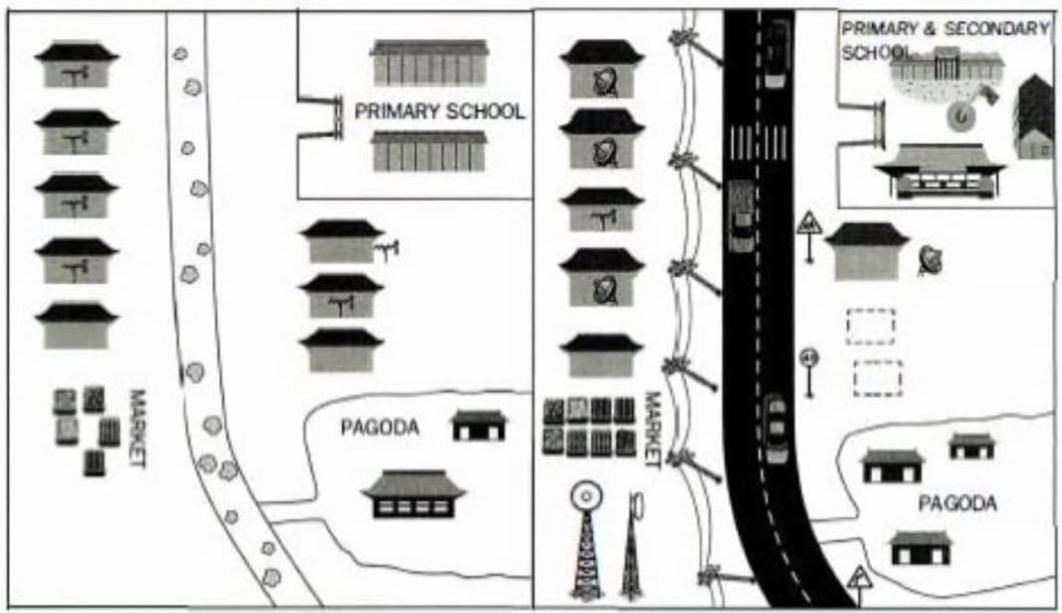
Soal IELTS Writing Task 1: Map of Pancha Village
The maps below show Pancha Village in 2005 and 2015.
Summarise the information by selecting and reporting the main features, and make comparisons where relevant.
Baca juga: Tips Mengerjakan IELTS Writing Task 2
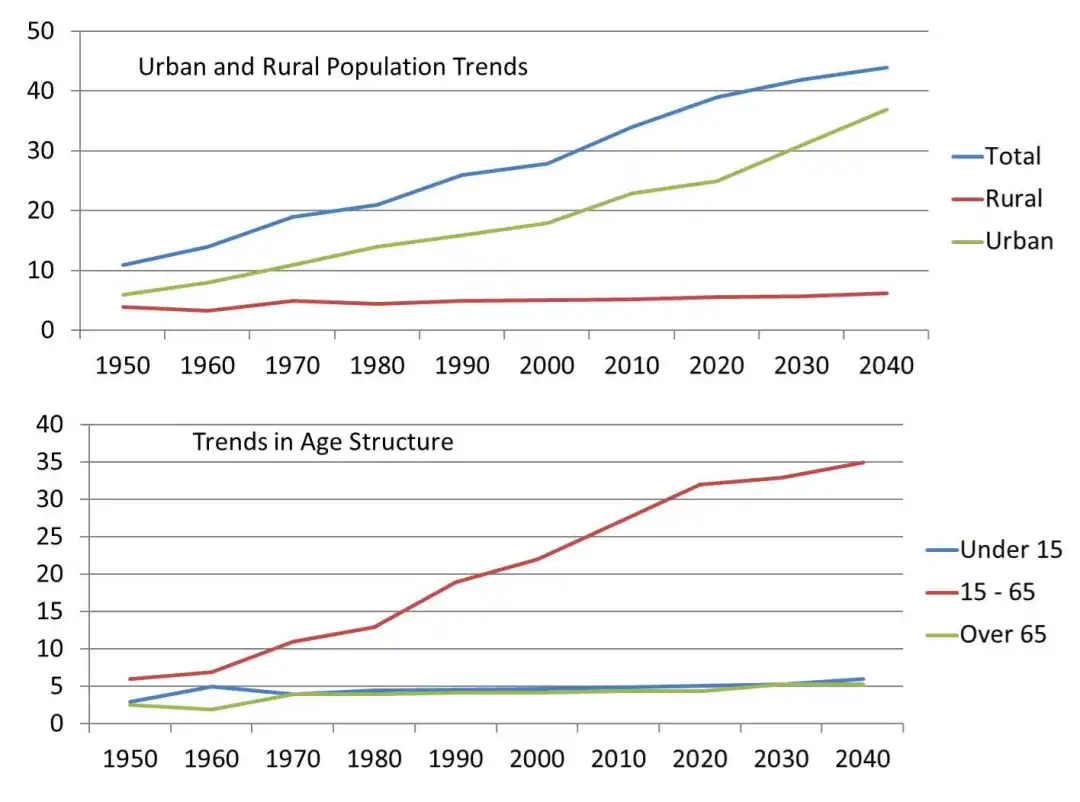
Soal IELTS Writing Task 1: Urban and Rural Population Trends
The bar chart illustrates population trends globally by percentage from 1950 to 2040.
Summarise the information by selecting and reporting the main features, and make comparisons where relevant.
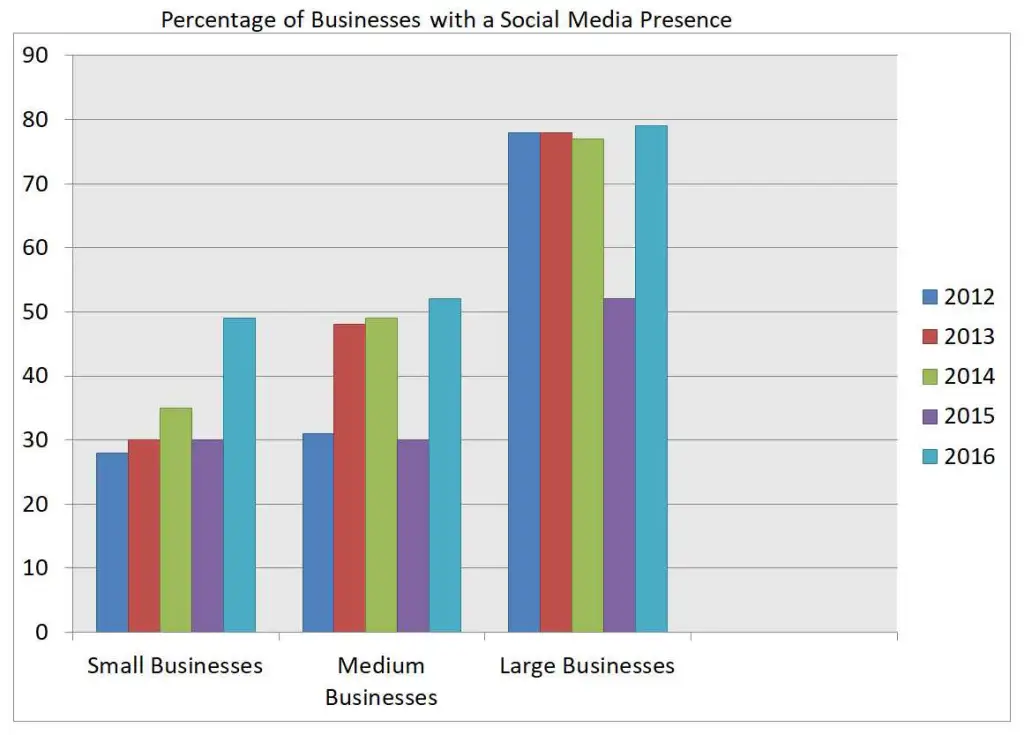
Soal IELTS Writing Task 1: Social Media Presence for Businesses
The bar chart illustrates the percentage of businesses in the UK who had a social media presence from 2012 to 2016.
Summarise the information by selecting and reporting the main features, and make comparisons where relevant.
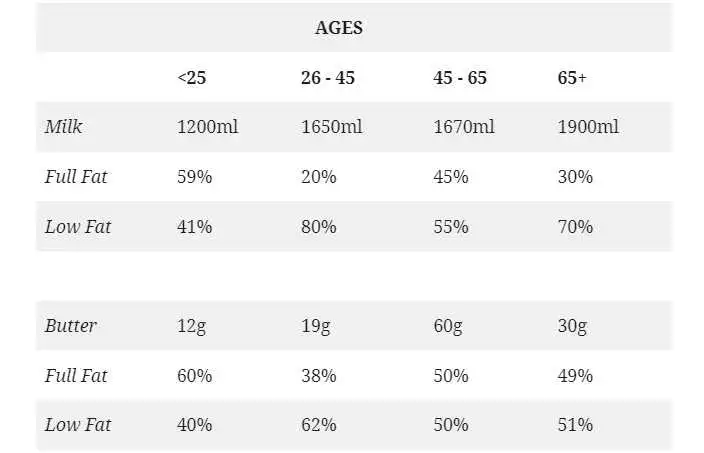
Soal IELTS Writing Task 1: Consumption of Milk and Butter
The table below illustrates weekly consumption by age group of dairy products in a European country.
Summarise the information by selecting and reporting the main features, and make comparisons where relevant.
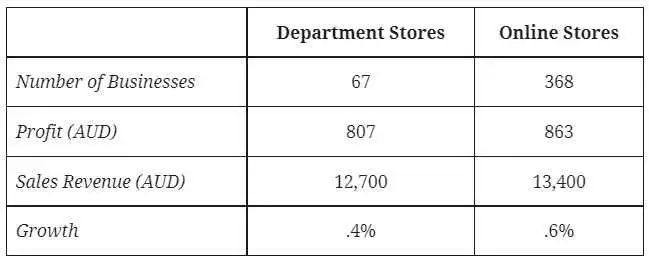
Soal IELTS Writing Task 1: Consumption of Milk and Butter
The table gives information about department and online stores in Australia in 2011.
Summarise the information by selecting and reporting the main features, and make comparisons where relevant.
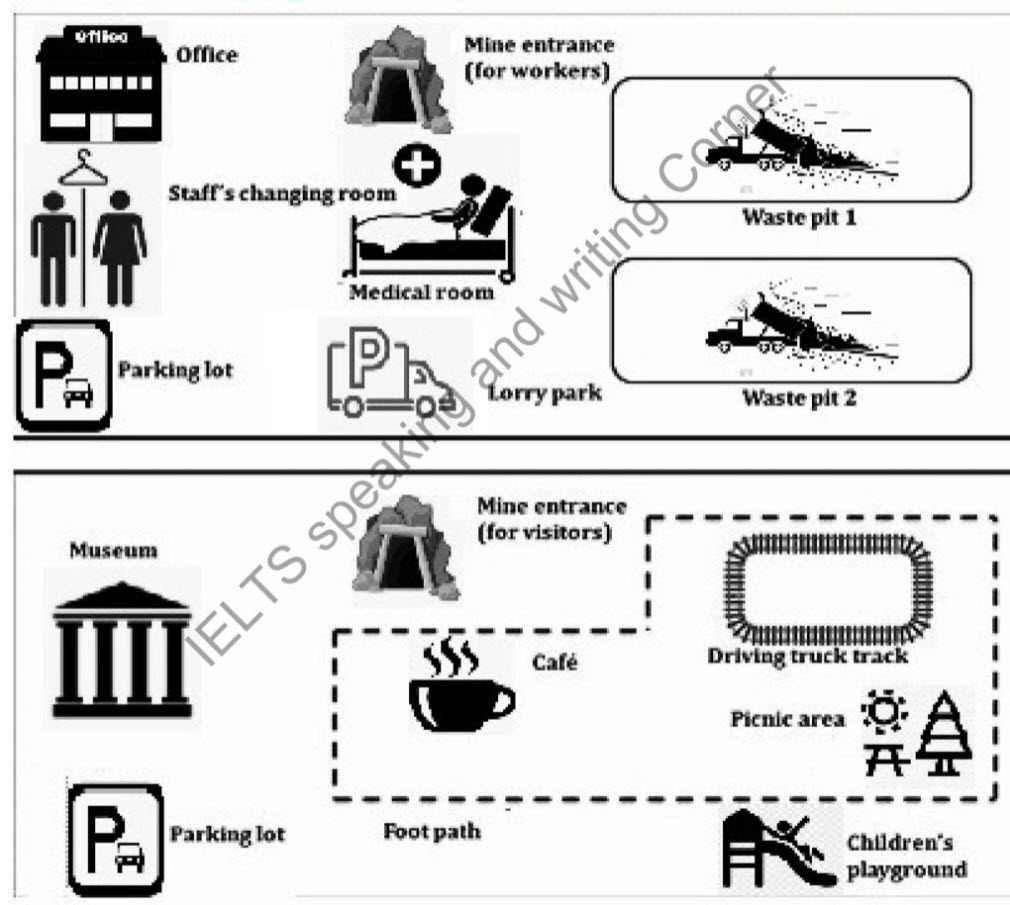
Soal IELTS Writing Task 1: Mining Town
The plans below show the site of mining town in the past and after redevelopment in the present day.
Summarise the information by selecting and reporting the main features, and make comparisons where relevant.
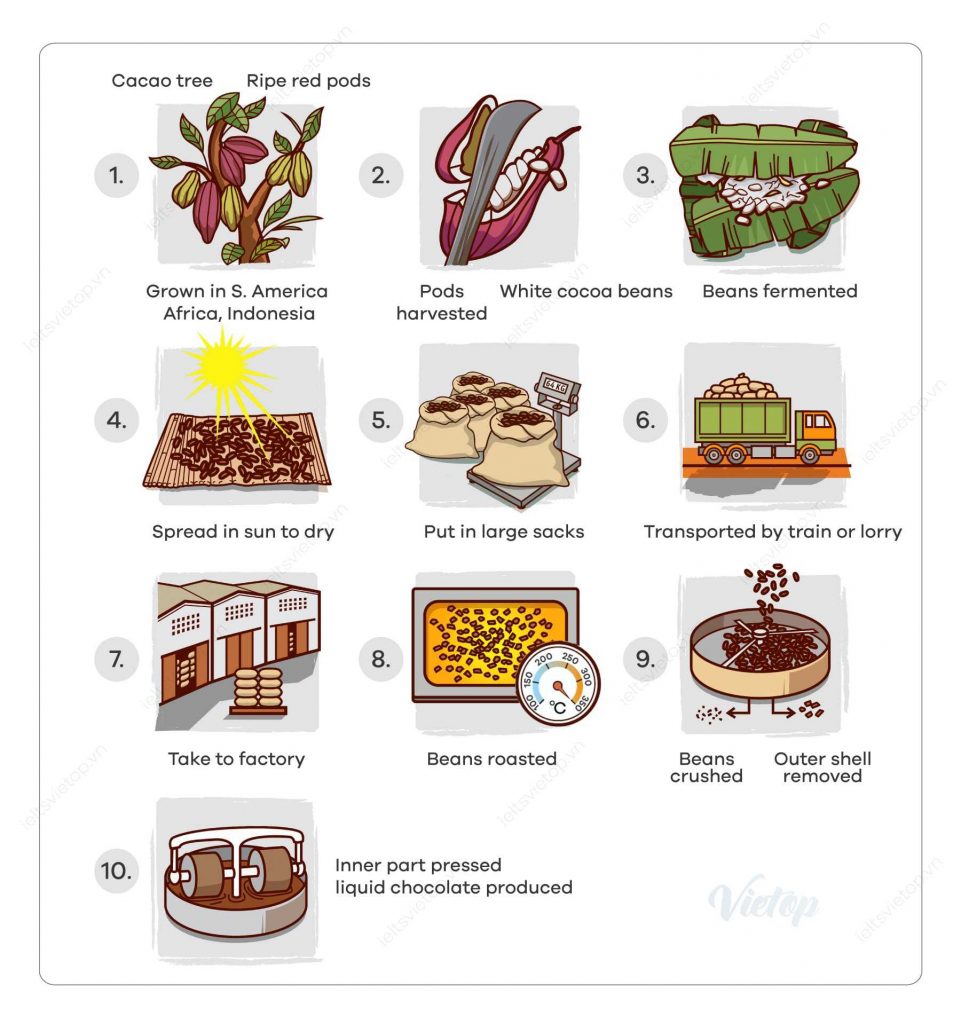
Soal IELTS Writing Task 1: Cocoa Beans and Chocolate Process Diagram
The process diagram details the steps by which liquid chocolcate is produced from cocoa beans.
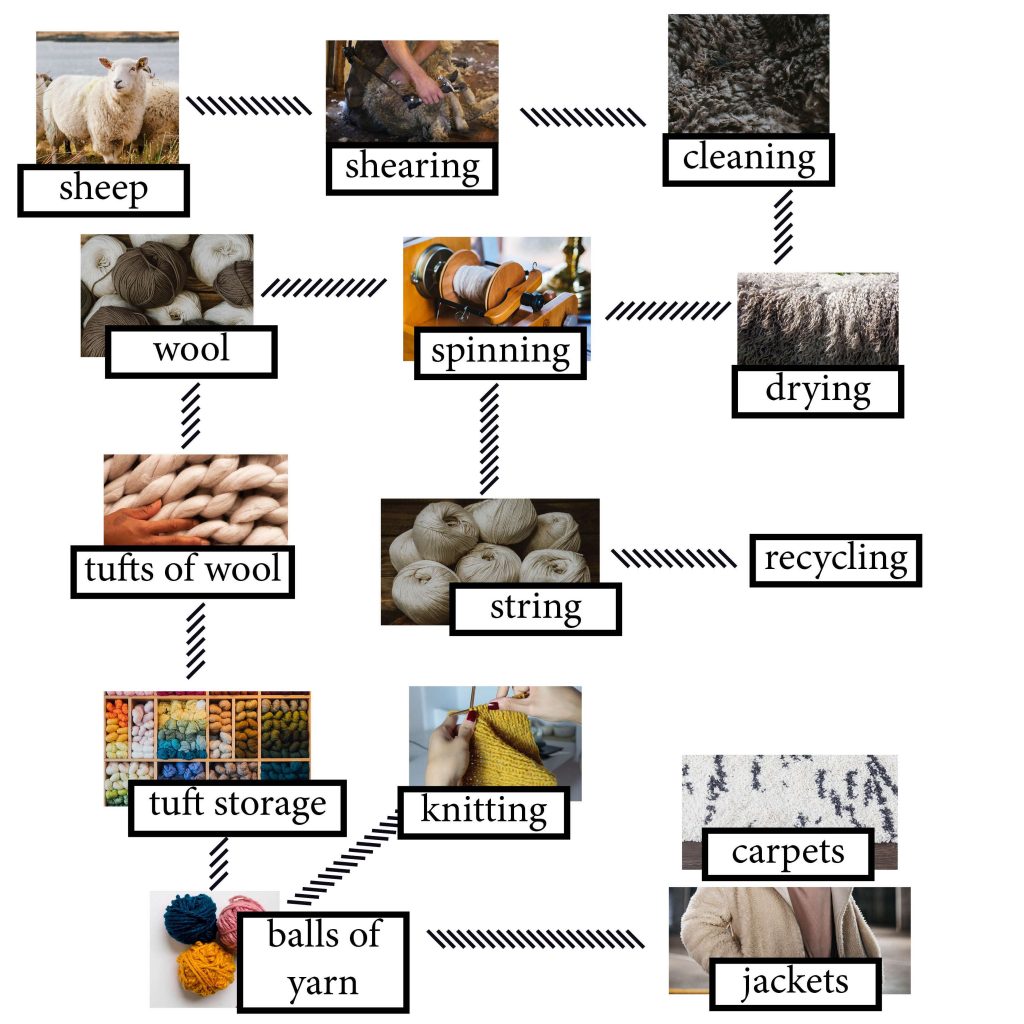
Soal IELTS Writing Task 1: Wool
The diagram details the process of making wool. Summarise the information by selecting and reporting the main features, and make comparisons where relevant.
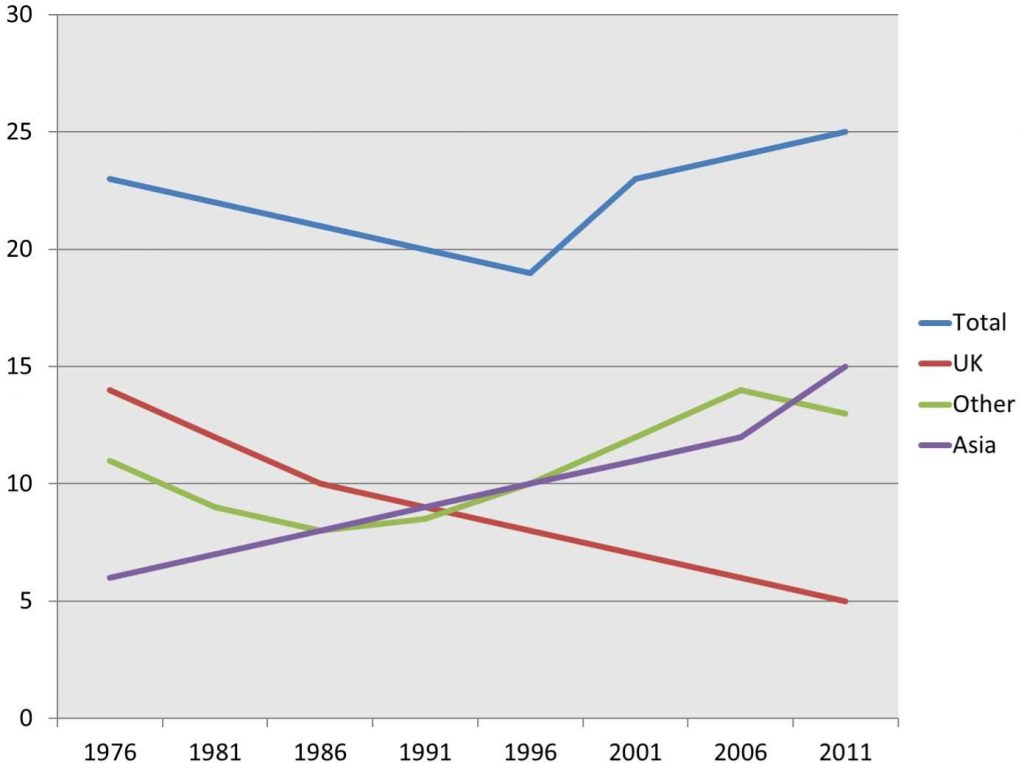
Soal IELTS Writing Task 1: Australian Residents
The line chart details the proportion of residents living in Australia in millions from different regions between 1976 and 2011.
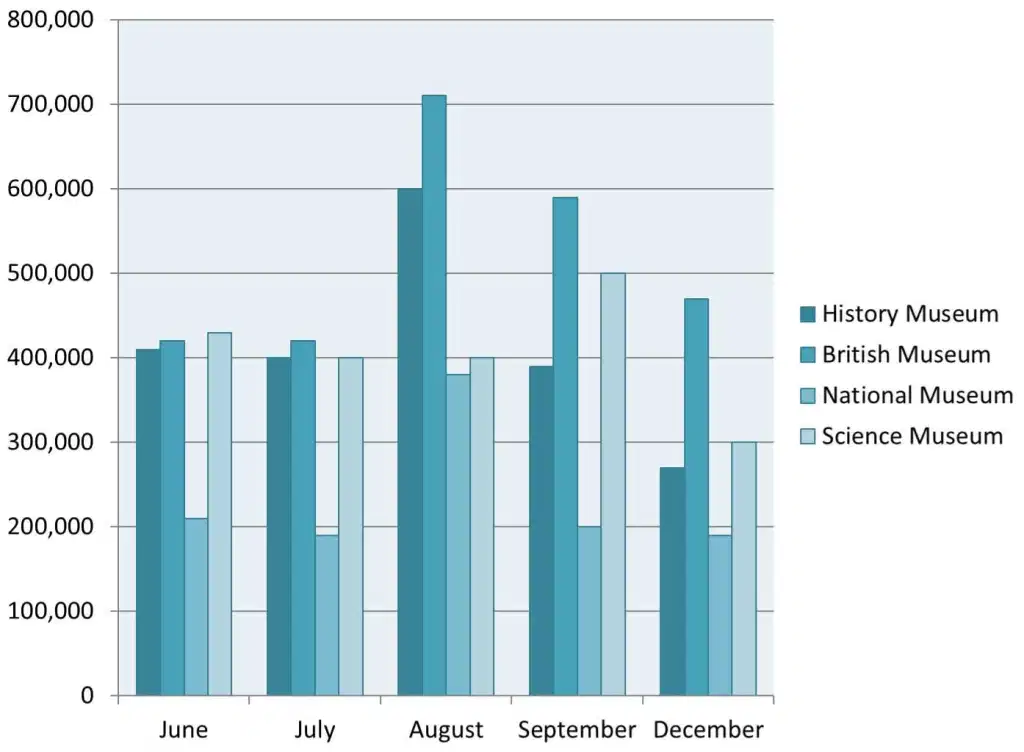
Soal IELTS Writing Task 1: Museums
The bar chart shows the number of visitors to four London museums.
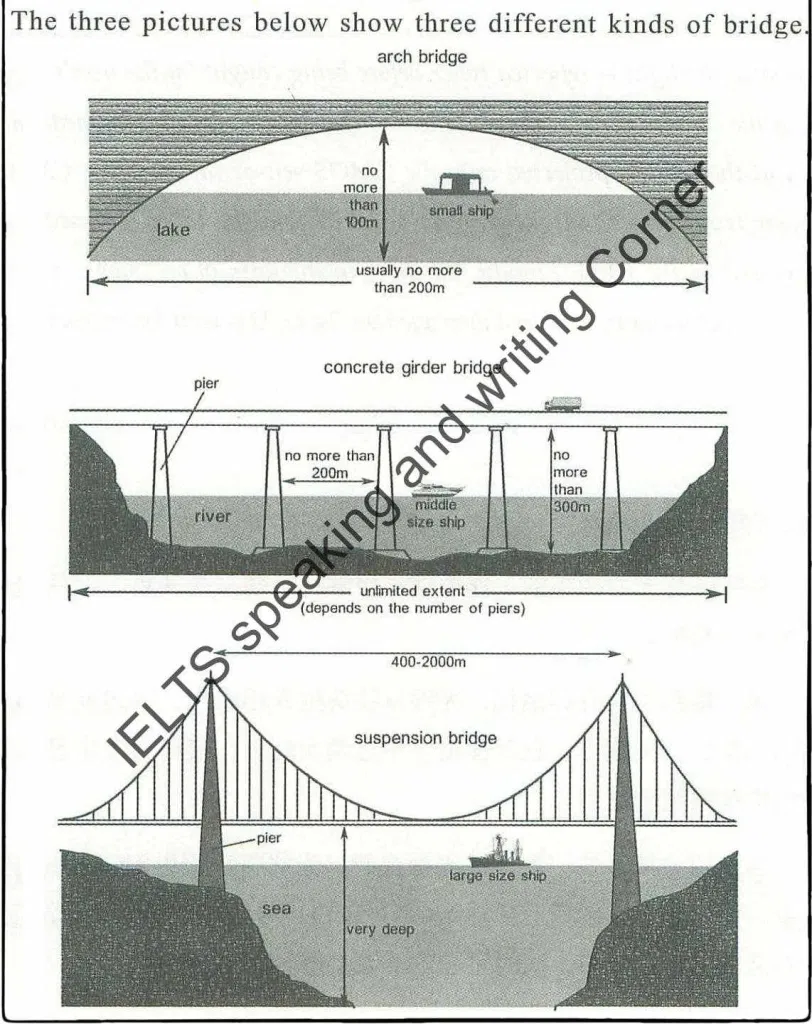
Soal IELTS Writing Task 1: Bridges
Baca juga: Cara Menghitung Skor IELTS
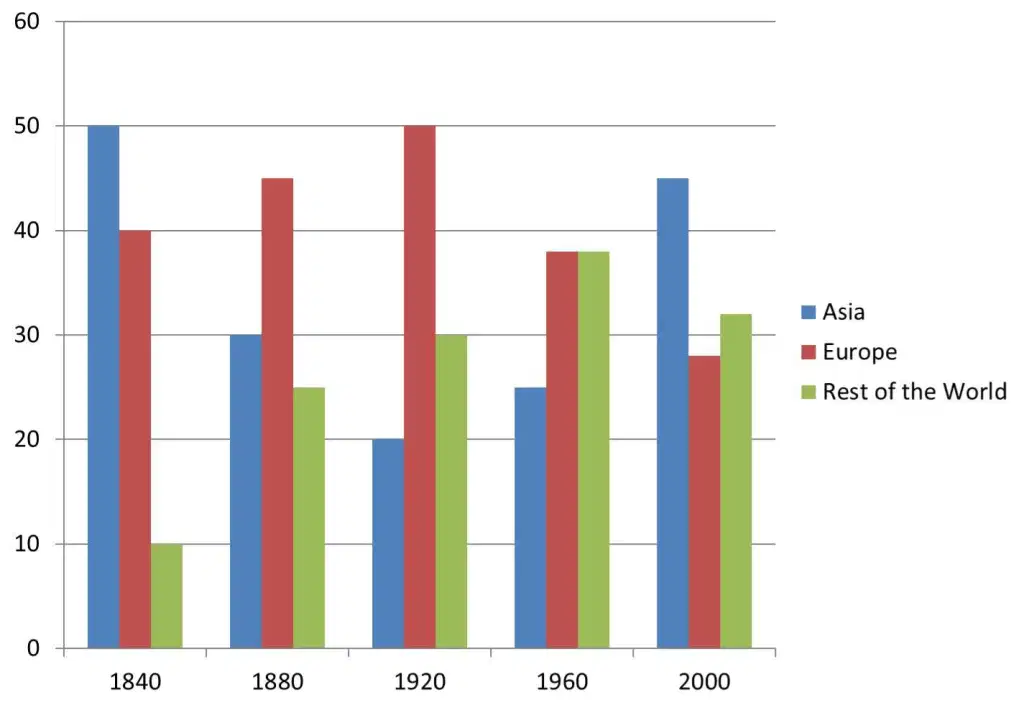
Soal IELTS Writing Task 1: World Production
The bar graph shows the total manufacturing production in percentages Asia, Europe, and the rest of the world.
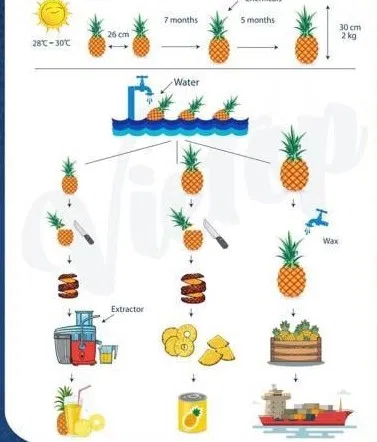
Soal IELTS Writing Task 1: Pineapple Process
The process diagram details the steps by which pineapples are produced for sale.
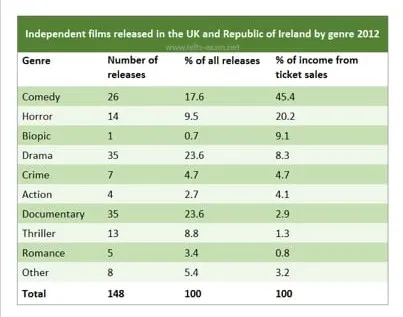
Soal IELTS Writing Task 1: Independent Films Table
The table shows independent film releases by genre in the UK and Republic of Ireland in 2012.
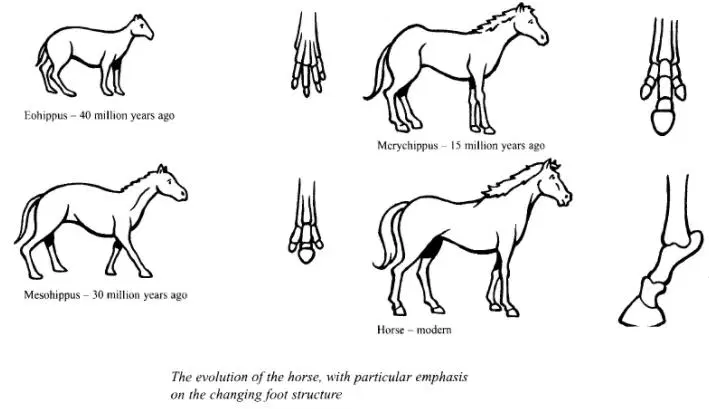
Soal IELTS Writing Task 1: Horse Diagram
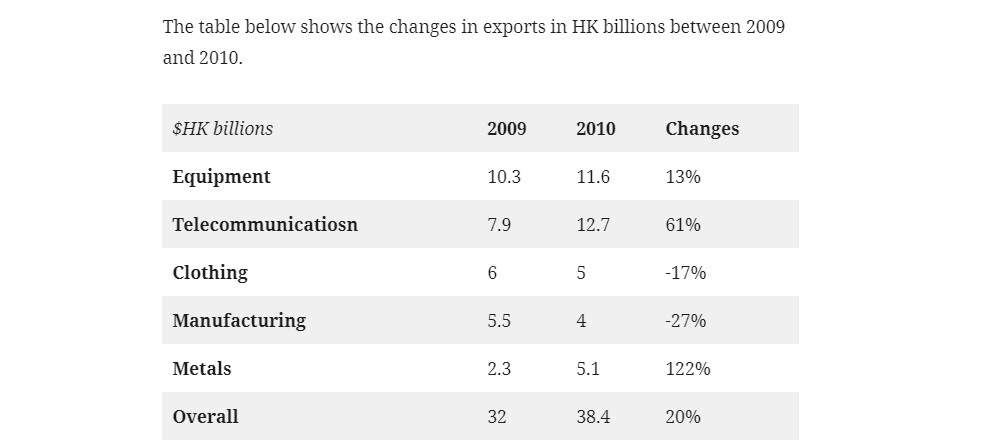
Soal IELTS Writing Task 1: Exports Table
The table below shows the changes in exports in HK billions between 2009 and 2010.
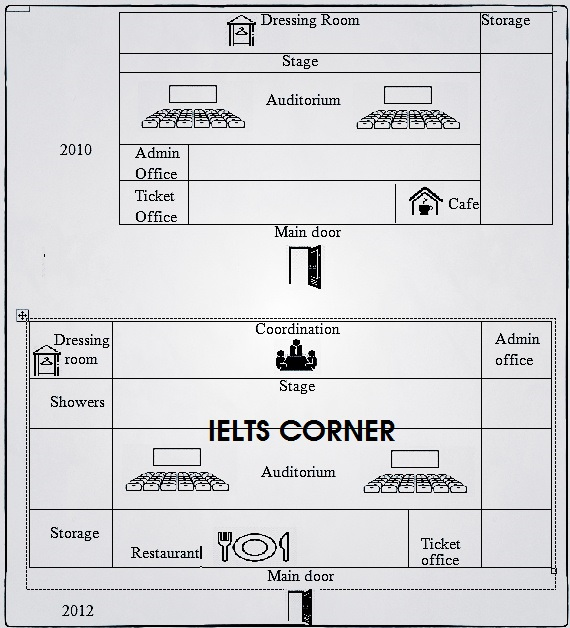
Soal IELTS Writing Task 1: Floorplan of a Theatre
The plans below show a theatre in 2010 and 2012. Summarise the information by selecting and reporting the main features and making comparisons where relevant.
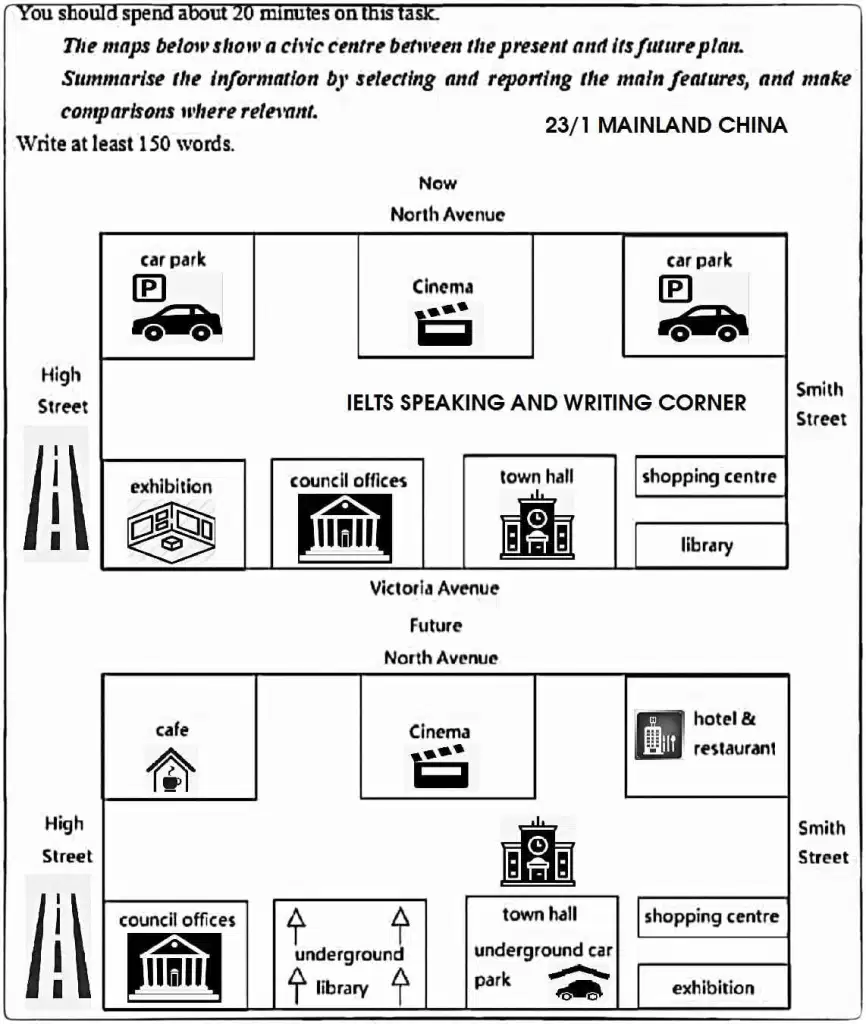
Soal IELTS Writing Task 1: A Theatre in 2010 and 2012
The plans below show a theatre in 2010 and 2012. Summarise the information by selecting and reporting the main features and making comparisons where relevant.
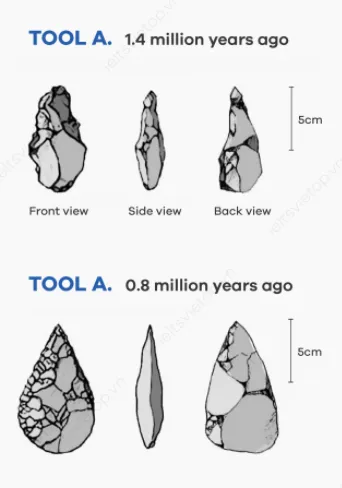
Soal IELTS Writing Task 1: Prehistoric Tools
The diagrams below illustrate early toos from 1.4 million years ago and 800,000 years ago. Summarise the information by selecting and reporting the main features and making comparisons where relevant.
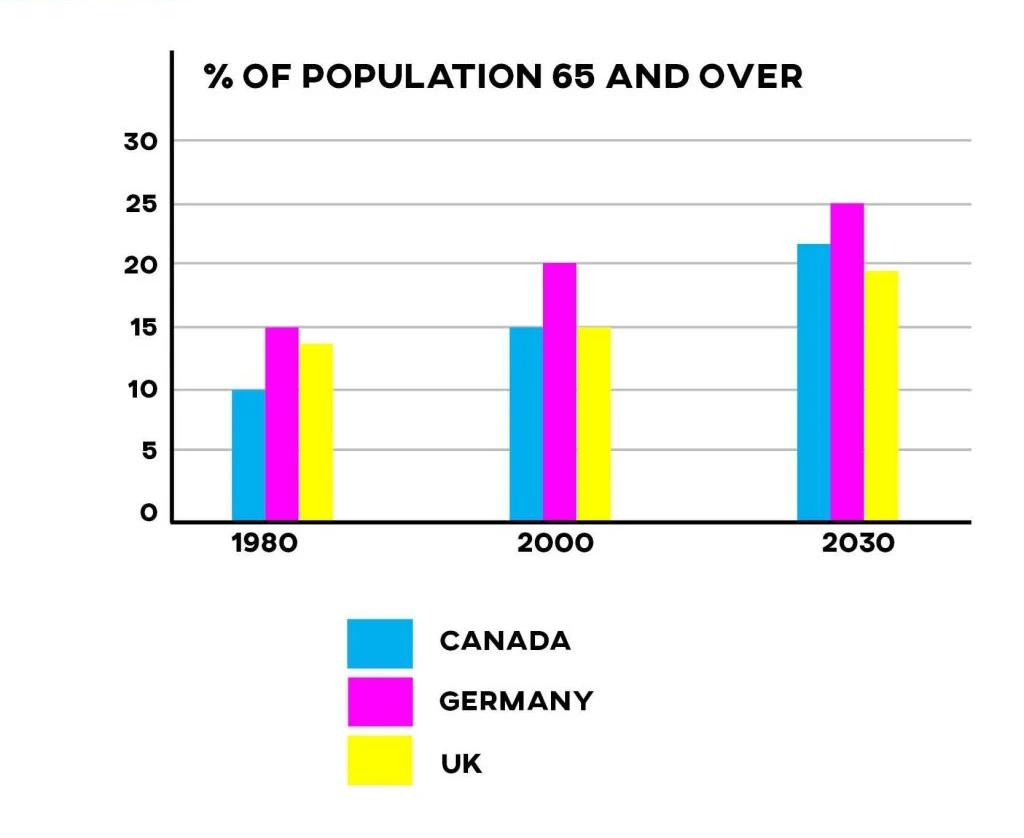
Soal IELTS Writing Task 1: Seniors
The bar chart shows the percentage of elderly citizens in three countries in 1980, 2000, and 2030. Summarise the information by selecting and reporting the main features, and make comparisons where relevant.
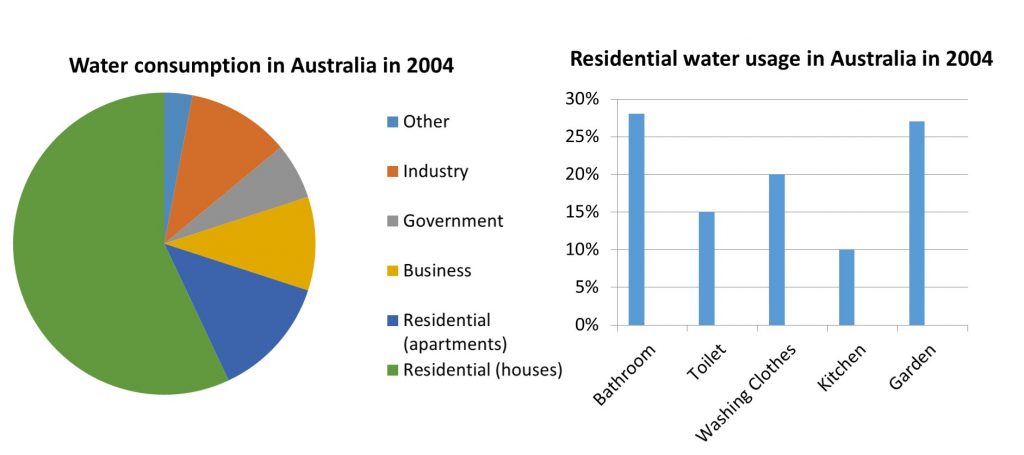
Soal IELTS Writing Task 1: Water Usage Australia
Baca juga: Contoh Pertanyaan IELTS Speaking Part 1
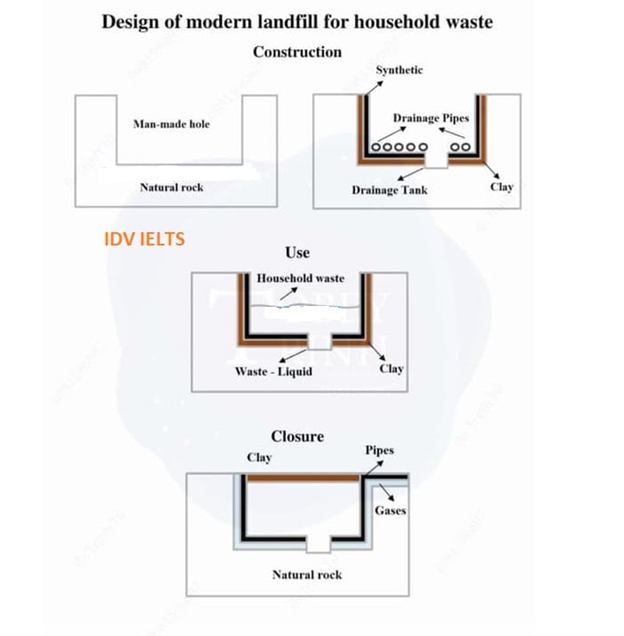
Soal IELTS Writing Task 1: Landfill for Household Waste
The process details designs of a modern landfill for household waste.
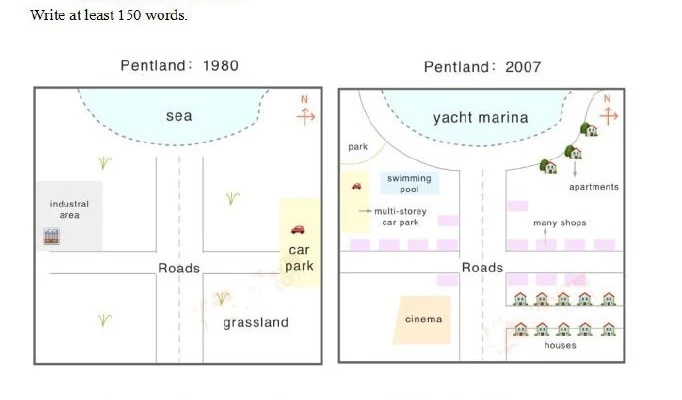
Soal IELTS Writing Task 1: Map of Pentland
You should spend about 20 minutes on this task.
The map show the change of selecting and reporting the main features and make comparisons where relevant.
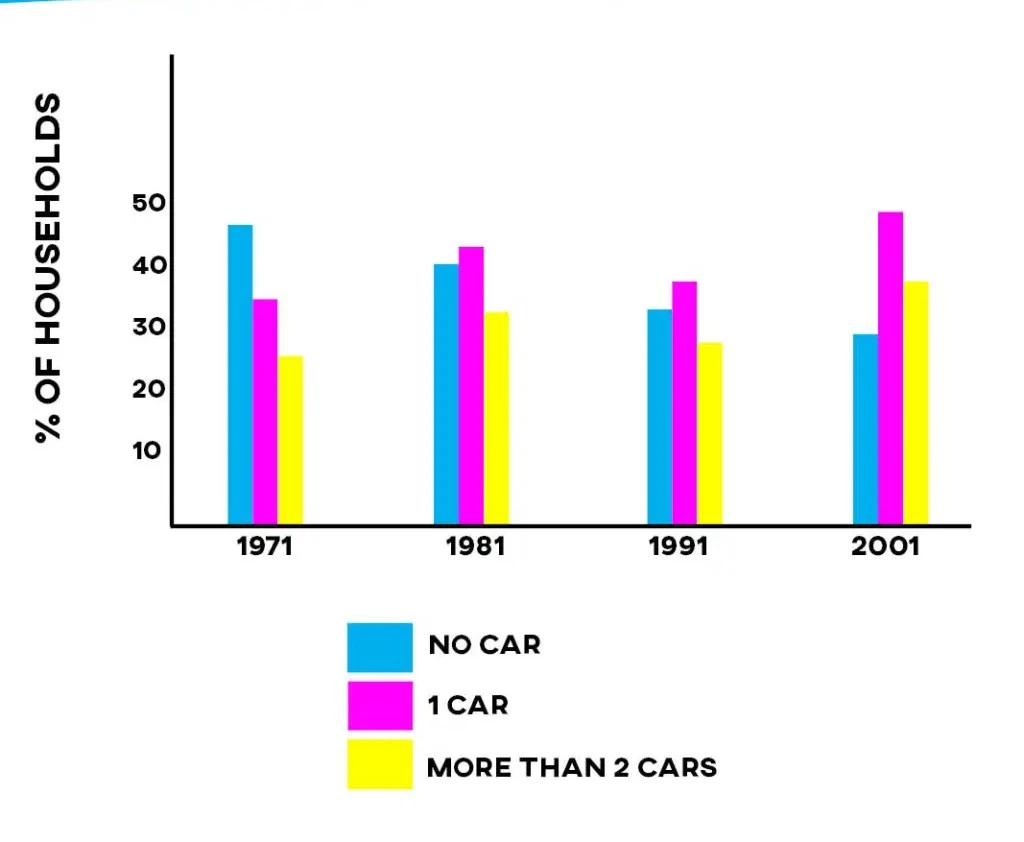
Soal IELTS Writing Task 1: Households with Cars
The bar chart shows the percentage of households with cars in a European country between 1971 and 2001. Summarise the information by selecting and reporting the main features and make comparisons where relevant.
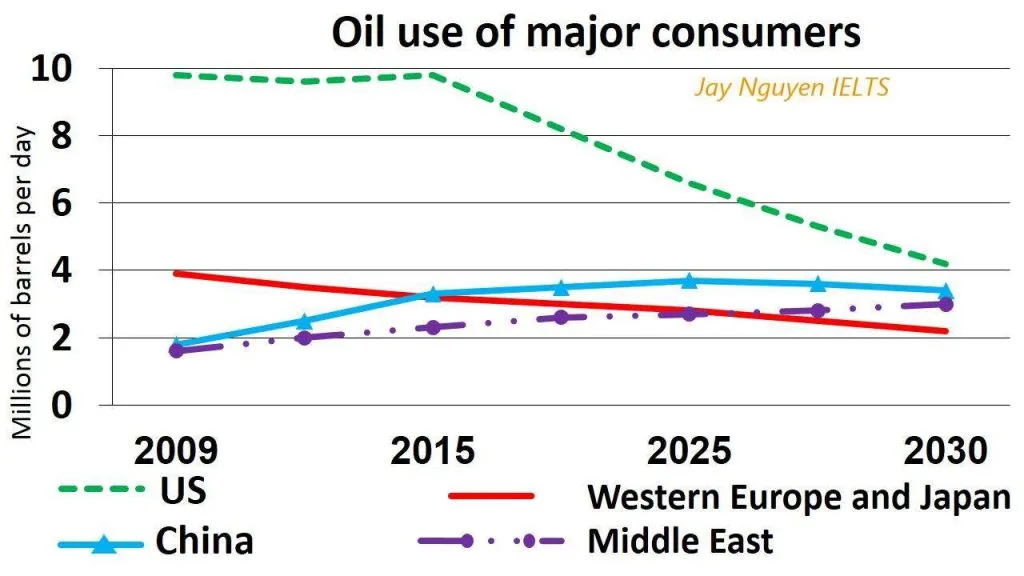
Soal IELTS Writing Task 1: Oil Use
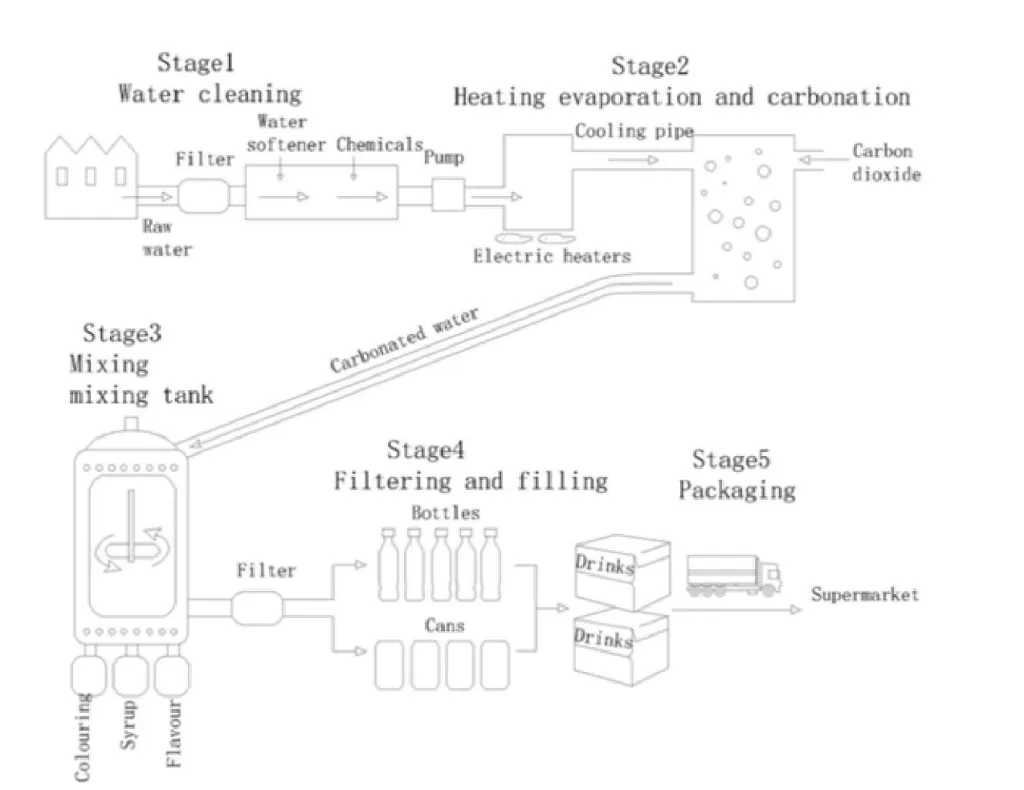
Soal IELTS Writing Task 1: Carbonated Drinks
Summarise the information by selecting and reporting the main features and make comparisons where relevant.
Baca juga: Contoh Pertanyaan IELTS Speaking Part 2
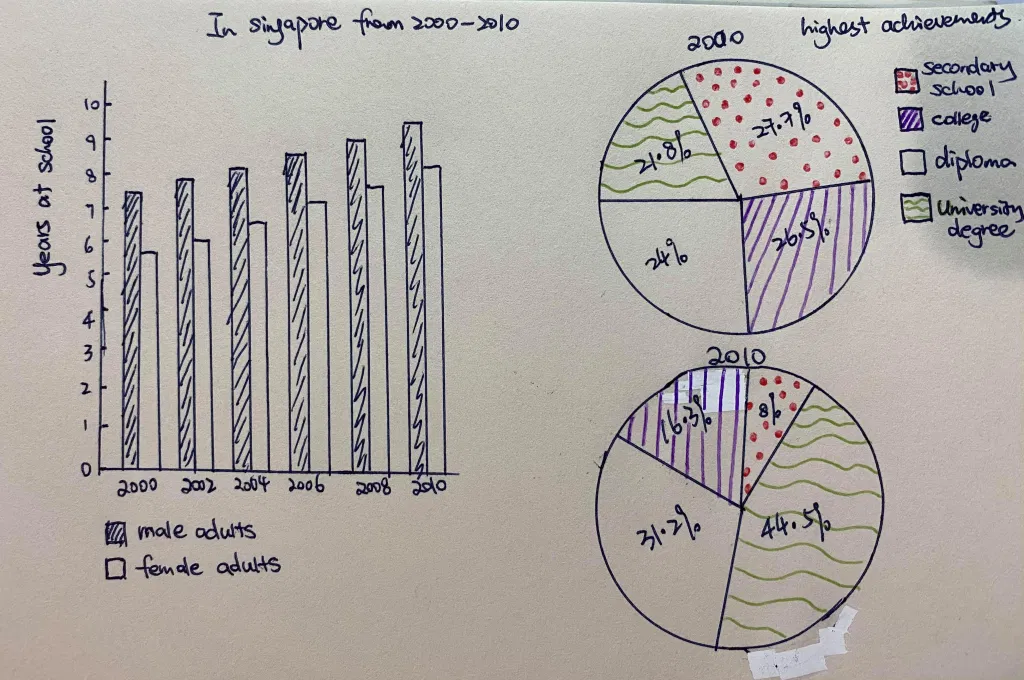
Soal IELTS Writing Task 1: Two Graphs (Pie and Bar Charts)
Summarise the information by selecting and reporting the main features and make comparisons where relevant.
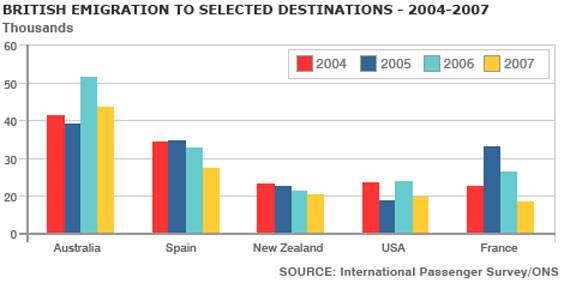
Soal IELTS Writing Task 1: British Emigration
Summarise the information by selecting and reporting the main features and make comparisons where relevant.
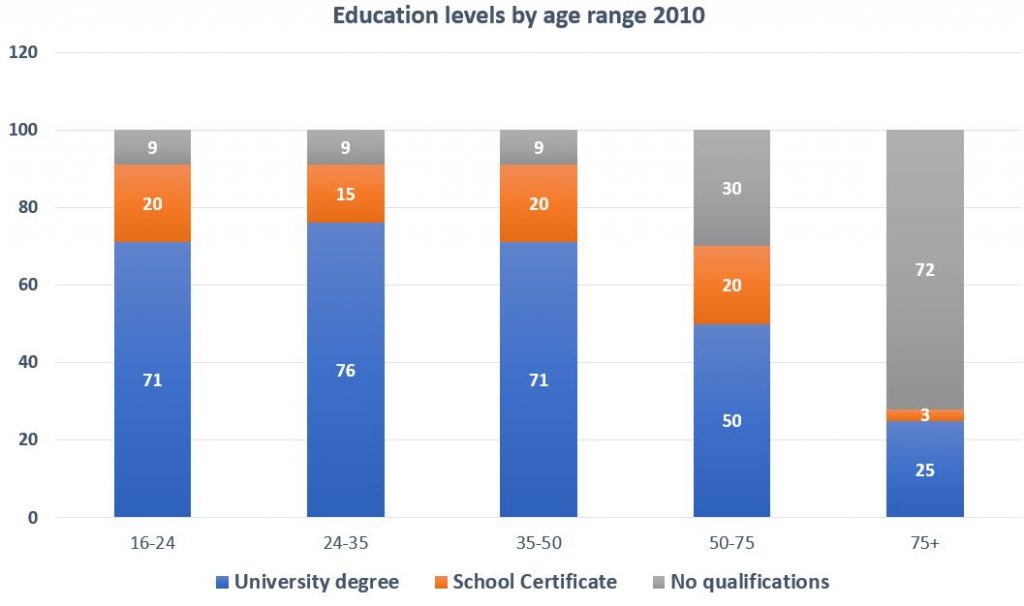
Soal IELTS Writing Task 1: Bar Chart (Education)
The chart below gives information about levels of education by age range in the UK in 2010.
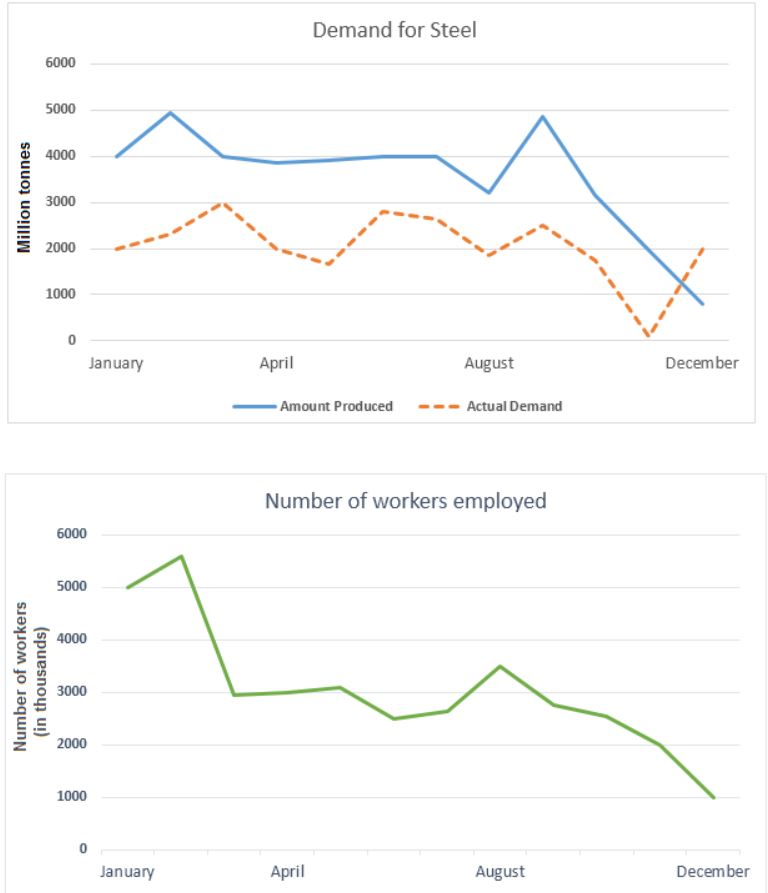
Soal IELTS Writing Task 1: Line Graph (Steel)
The line charts give information about the demand for steel and number of workers employed in a country from January to December.
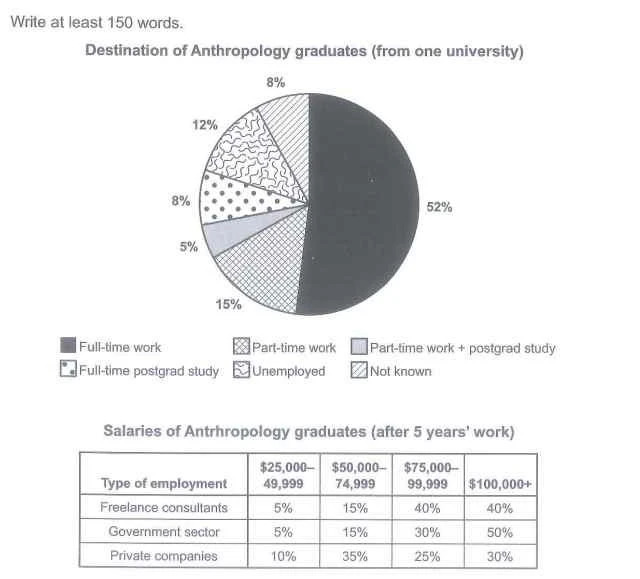
Soal IELTS Writing Task 1: Anthropology Graduates
The chart bellows shows what Anthropology graduates from one university did after finishing their undergraduate degree course. The table shows the salaries of the anthropologist in work after five years. Summarise the information by selecting and reporting the main features and make comparisons where relevant.
Baca juga: Tips Mengerjakan IELTS Writing Task 2
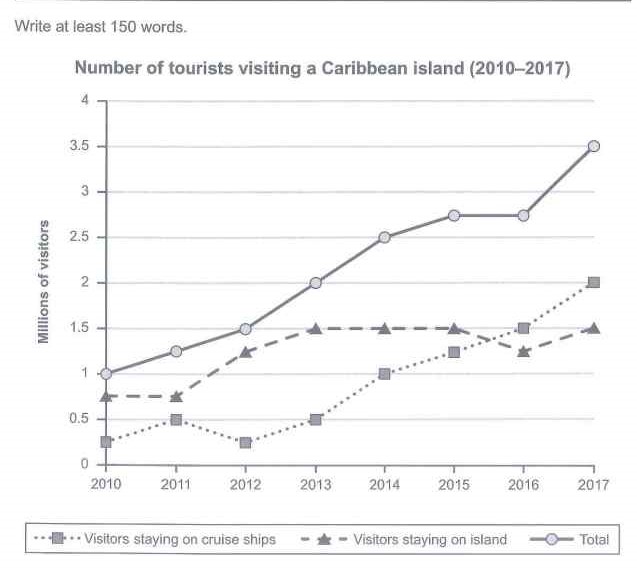
Soal IELTS Writing Task 1: Tourists Visiting a Caribbean Island
The graph below shows the number of tourist visiting a particular Caribbean Island between 2010 and 2017. Summarise the information by selecting and reporting the main features and make comparisons where relevant.
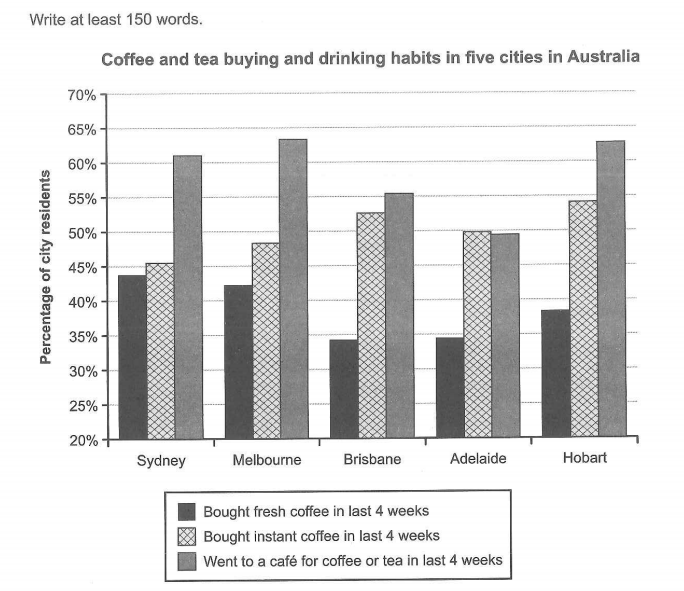
Soal IELTS Writing Task 1: Coffee and Tea Buying and Drinking Habits
The chart below shows the results of survey about people’s coffee and tea buying and drinking habits in five Australian cities. Summarise the information by selecting and reporting the main features and make comparisons where relevant.
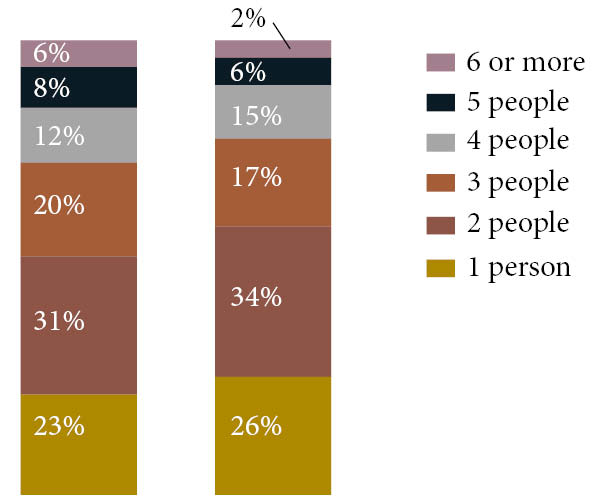
Soal IELTS Writing Task 1: UK Households Bar Chart
The chart compares the number of people per household by percentage in the UK in 1981 and 2001.
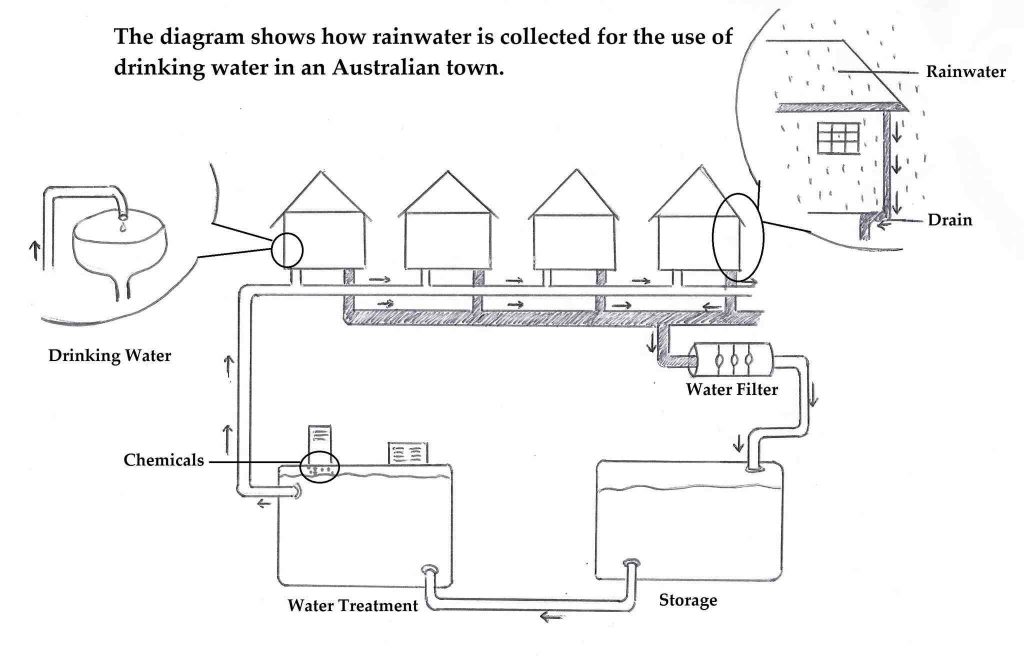
Soal IELTS Writing Task 1: Rainwater Diagram/Process
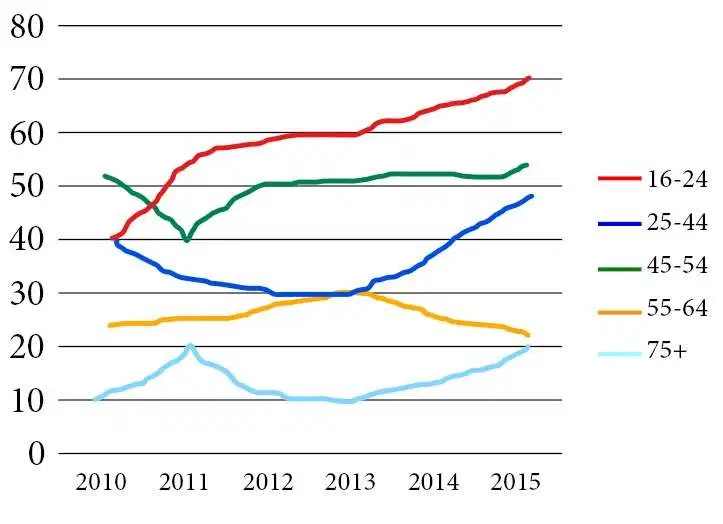
Soal IELTS Writing Task 1: Concerts Line Chart
The graph below shows the percentage of people in different age groups in one city who attended music concerts between 2010 and 2015.
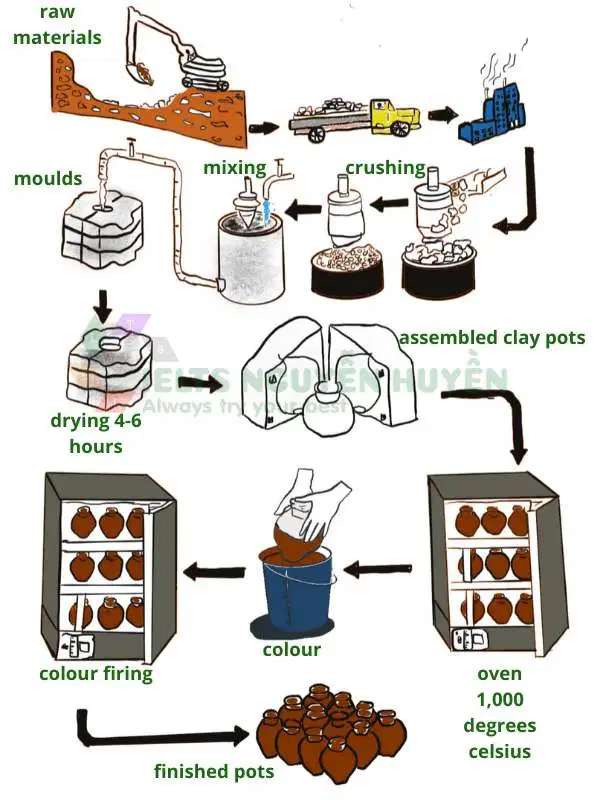
Soal IELTS Writing Task 1: Ceramic Pots Process
The diagram below shows one method of manufacturing ceramic pots.
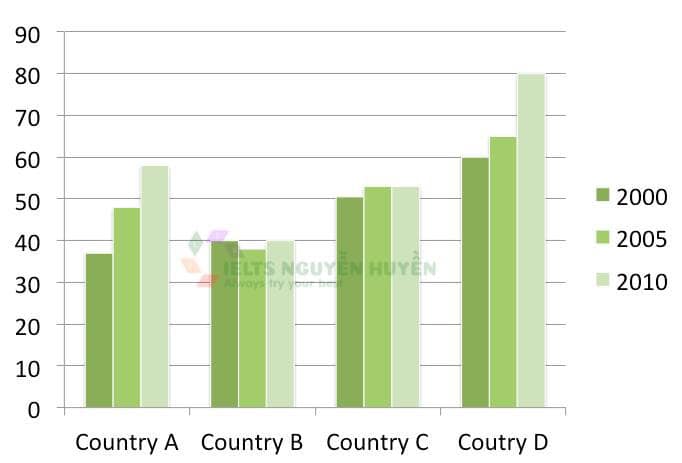
Soal IELTS Writing Task 1: Higher Education Bar Chart (Real Past IELTS Exam/Test)
The bar chart shows the percentage of young people in higher education in 2000, 2005 and 2010.
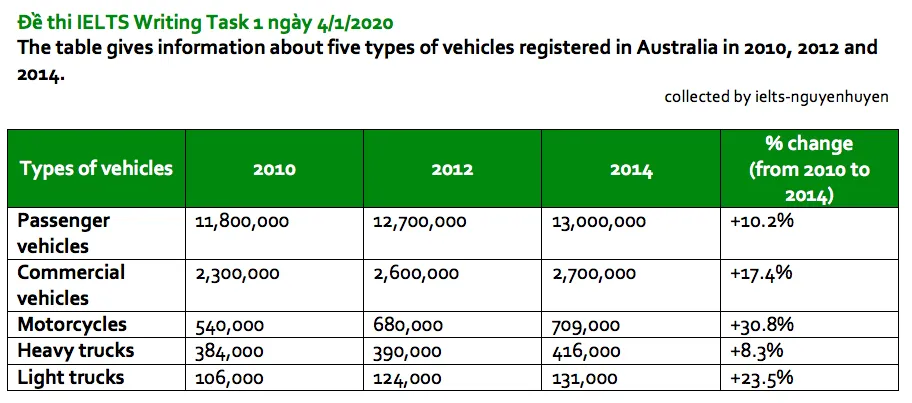
Soal IELTS Writing Task 1: Vehicles in Australia Table
The table gives information about five types of vehicles registered in Australia in 2010, 2012, and 2014.
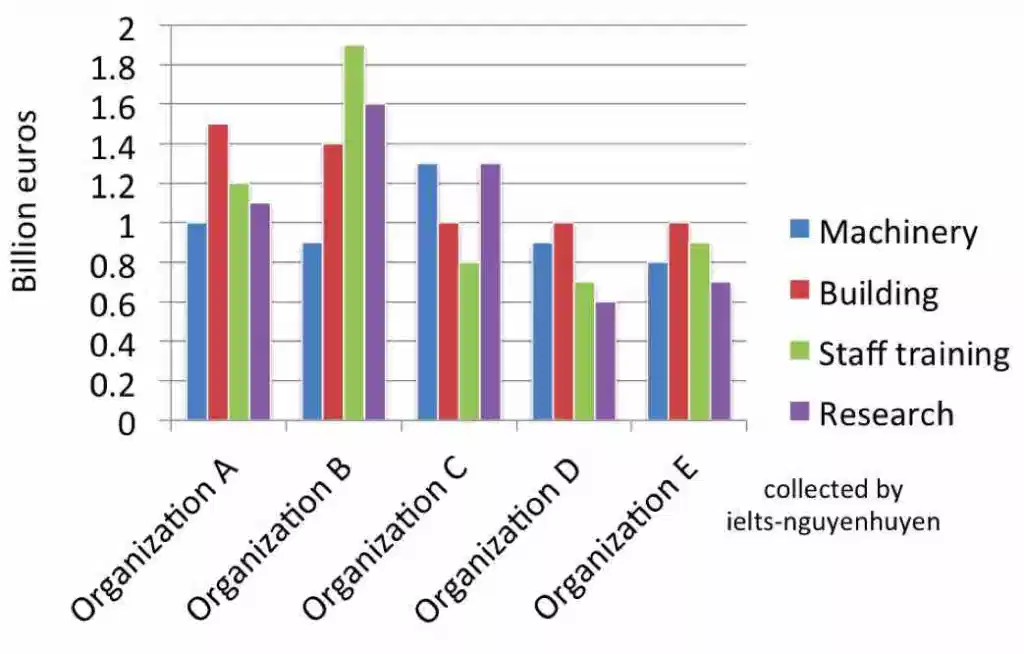
Soal IELTS Writing Task 1: Organisations Bar Chart (Real Past IELTS Tests/Exams)
The chart below gives information about billions of euros invested in four areas by various organisations.
Soal IELTS Writing Task 1: Table Kiwi Exports
The table below gives information about the value of exports of kiwi fruit from New Zealand to five countries between 2010 and 2012.

Baca juga: Contoh Soal IELTS Reading
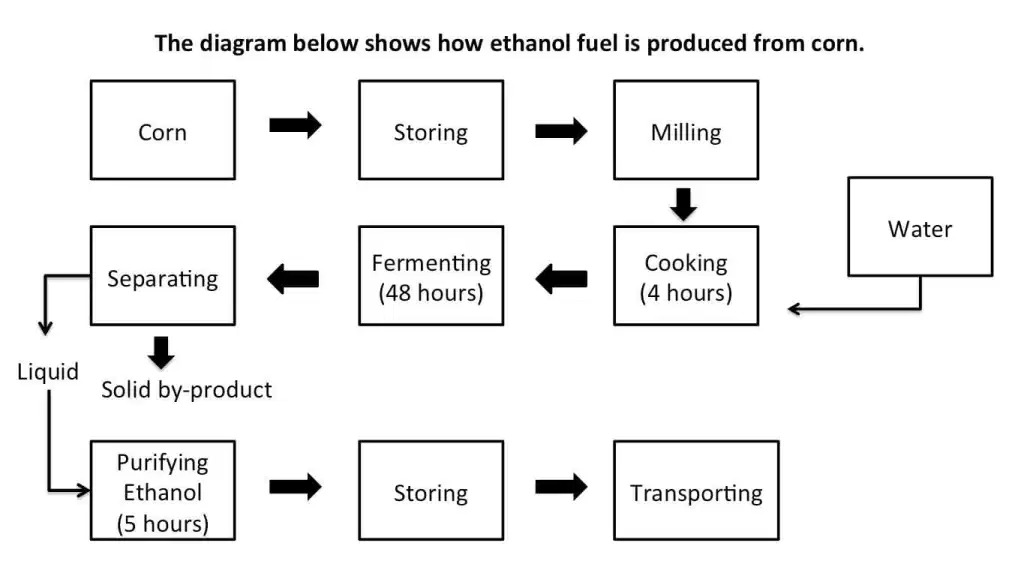
Soal IELTS Writing Task 1: How Ethanol Fuel is Produced From Corn
Summarise the information by selecting and reporting the main features and make comparisons where relevant.
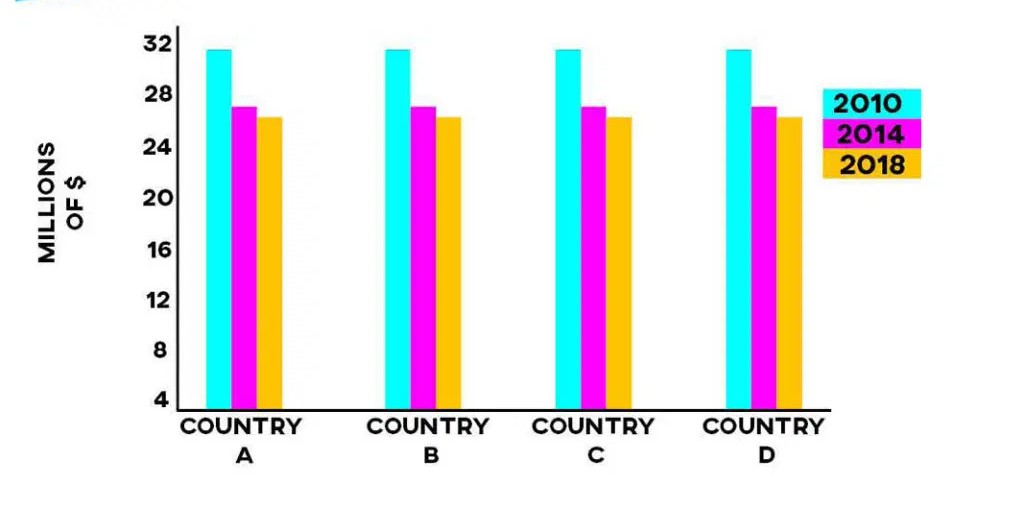
Soal IELTS Writing Task 1: The Changes in Medical Funding
The graph describes The Changes in Medical Funding in four countries from 2010 to 2018. Summarise the information by selecting and reporting the main features and make comparisons where relevant.
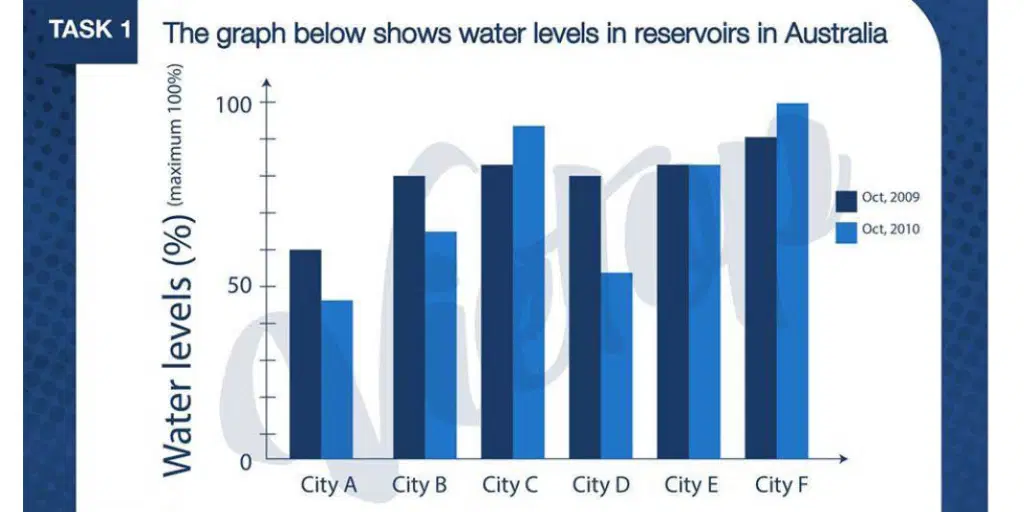
Soal IELTS Writing Task 1: Water Levels in Reservoirs in Australia
Summarise the information by selecting and reporting the main features and make comparisons where relevant.
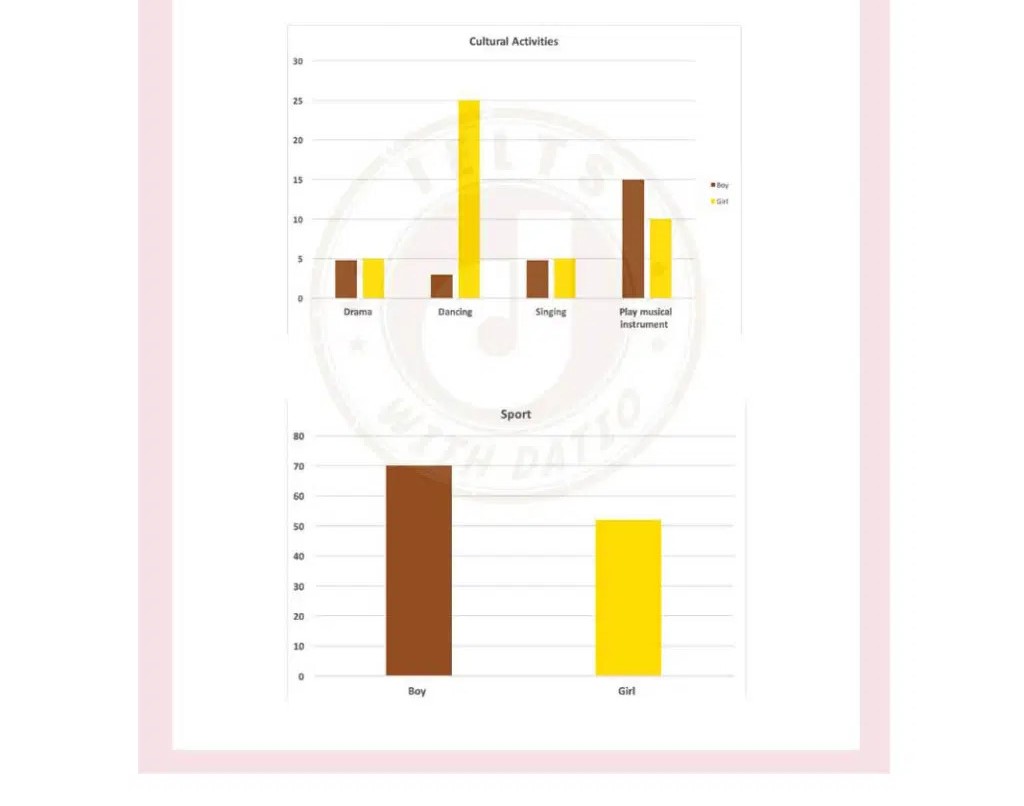
Soal IELTS Writing Task 1: Participated in Organized Cultural Activities and Sports
The graph below shows the percentage of boys and girls aged 5-14 who participated in organized cultural activities and sports in 2003 in Australia. Summarise the information by selecting and reporting the main features and make comparisons where relevant.
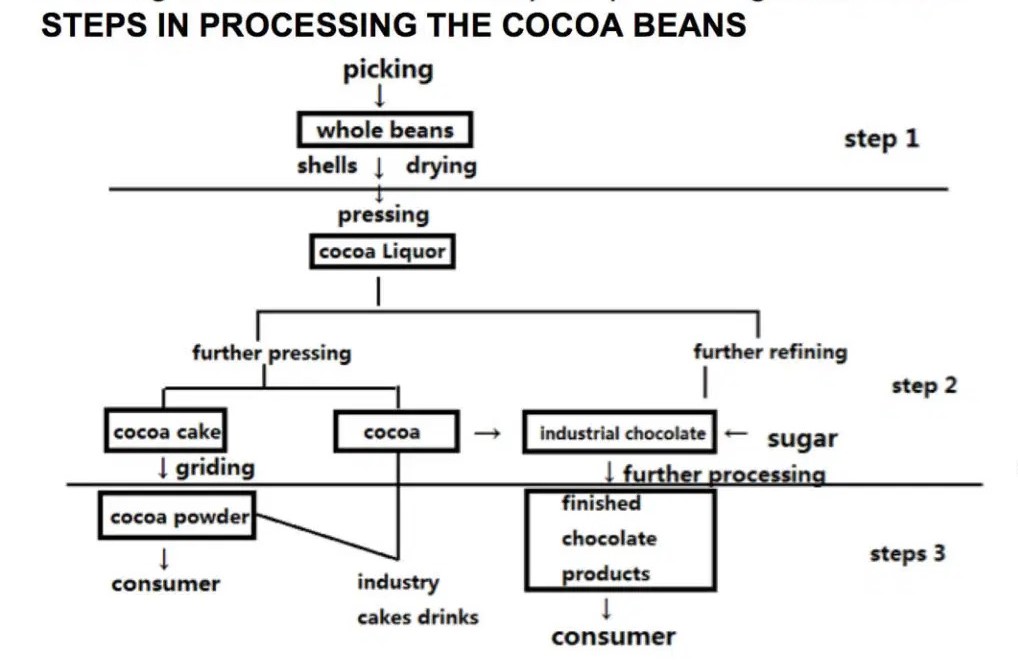
Soal IELTS Writing Task 1: Steps in Processing The Cocoa Beans
The diagram below shows the steps of processing cocoa beans. Summarise the information by selecting and reporting the main features and make comparisons where relevant.
Baca juga: Kursus IELTS Online Gratis
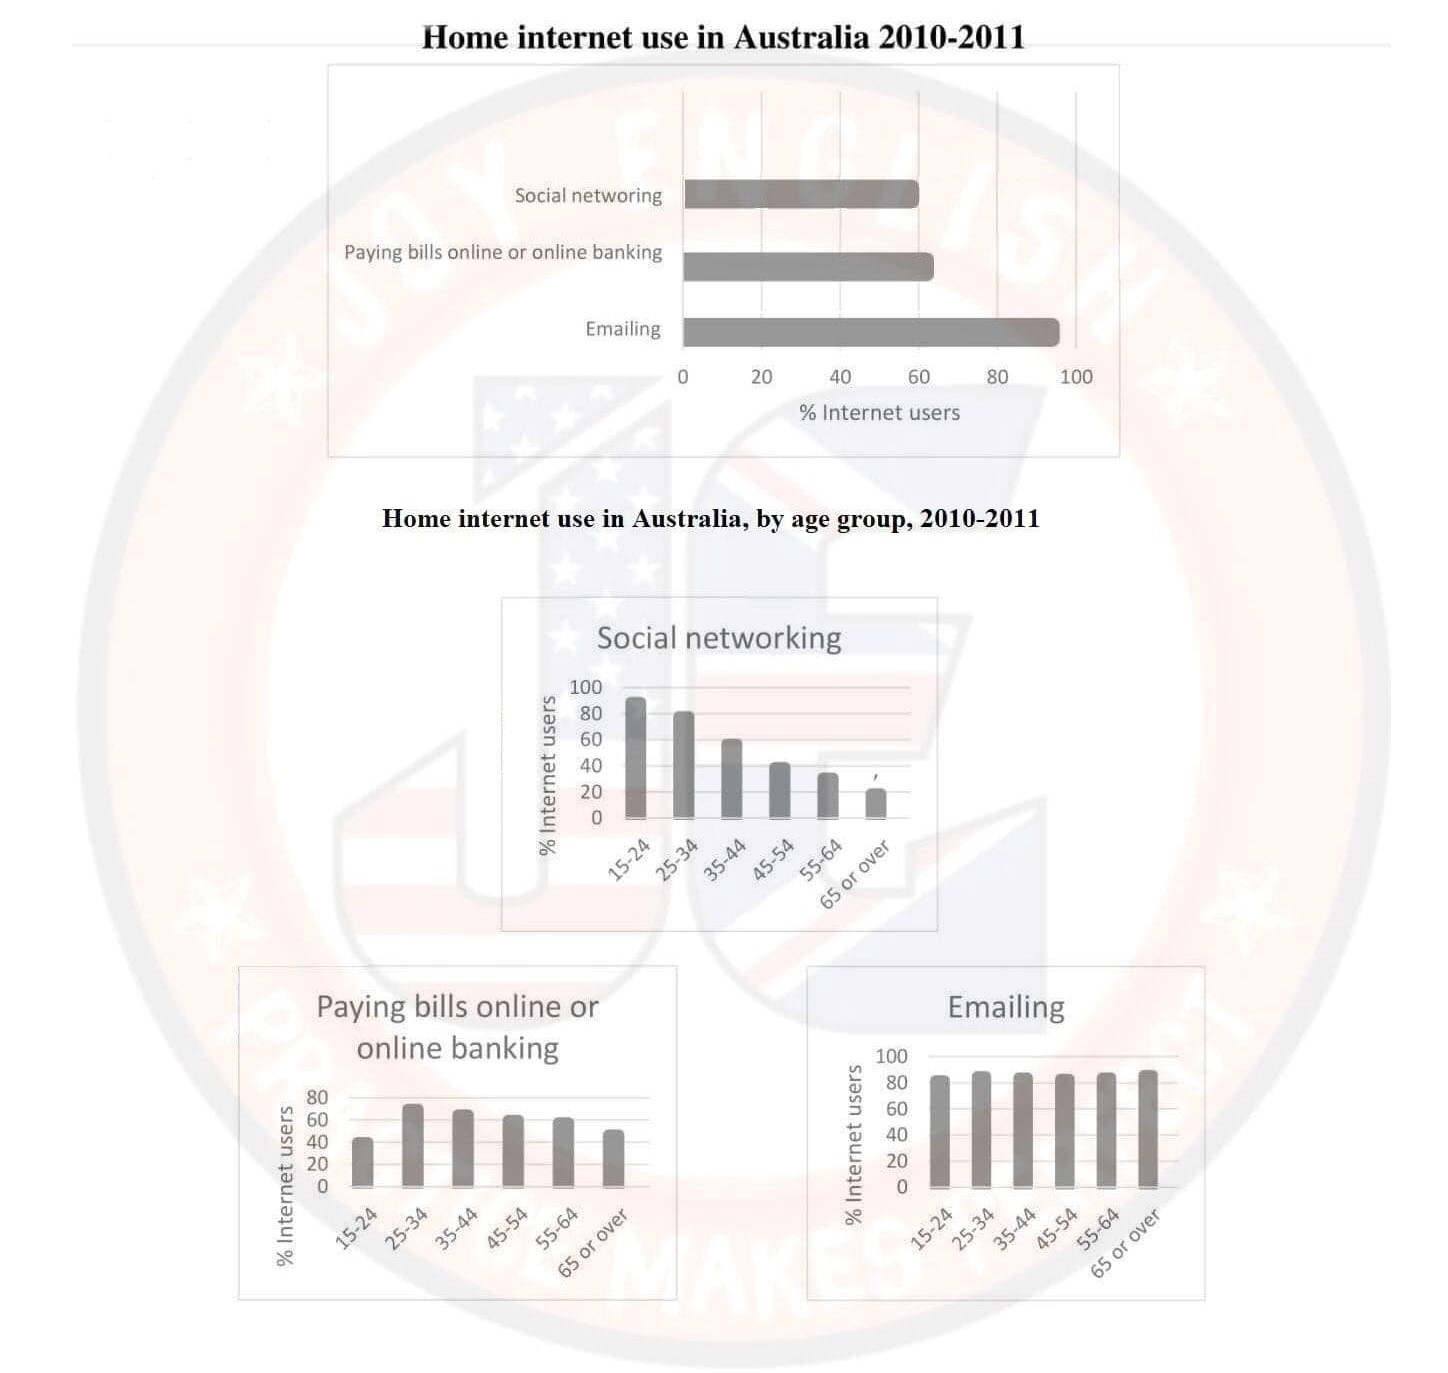
Soal IELTS Writing Task 1: Internet Use at Home
The charts bellow give information on Internet use at home in Australia between 2010 and 2011. Summarise the information by selecting and reporting the main features and make comparisons where relevant.
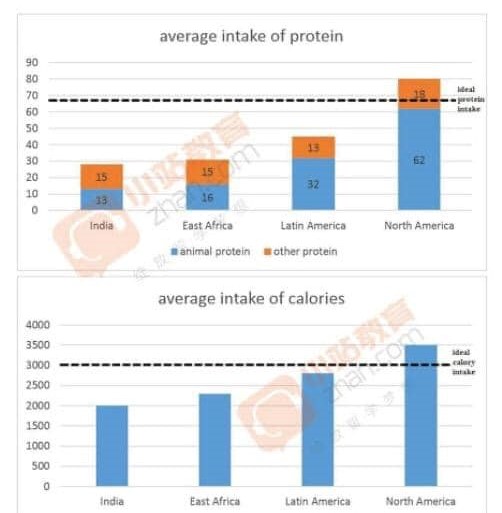
Soal IELTS Writing Task 1: The Protein and Calorie
The charts below show the protein and calorie intakes of people in different parts of the world. Compare and contrast.
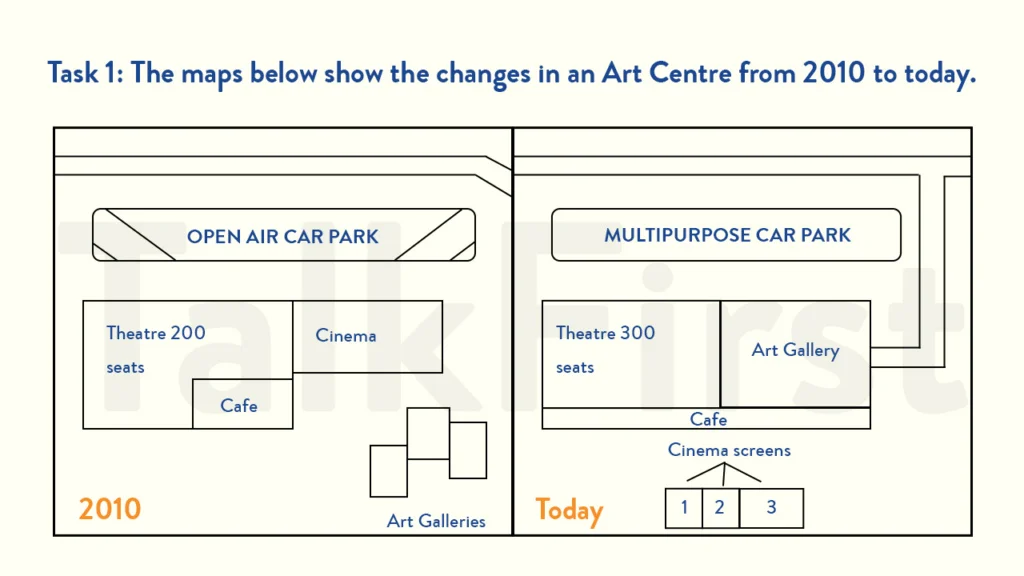
Soal IELTS Writing Task 1: The Maps an Art Centre
Summarise the information by selecting and reporting the main features and make comparisons where relevant.
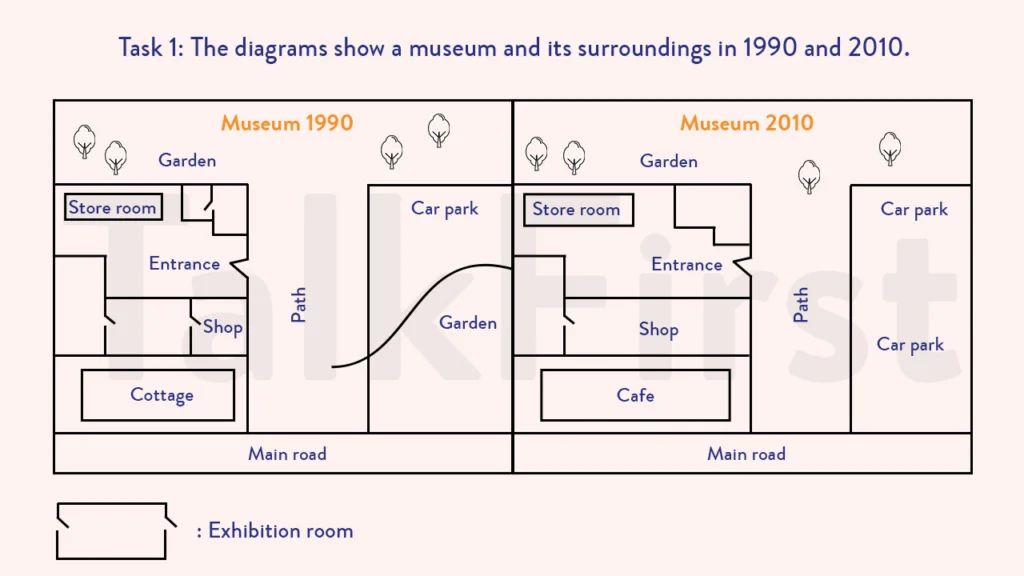
Soal IELTS Writing Task 1: A Museum and It’s Surroundings
Summarise the information by selecting and reporting the main features and make comparisons where relevant.
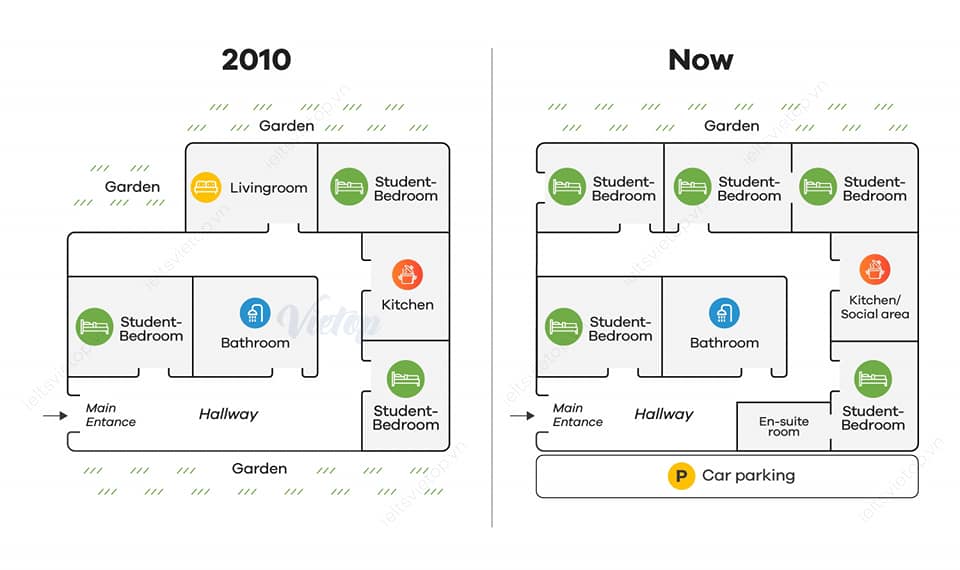
Soal IELTS Writing Task 1: A Student Accommodation Buildings
The plans below show a student accommodation buildings 2010 and now. Summarise the information by selecting and reporting the main features, and make comparisons where relevant.
Baca juga: Belajar Bahasa Inggris IELTS
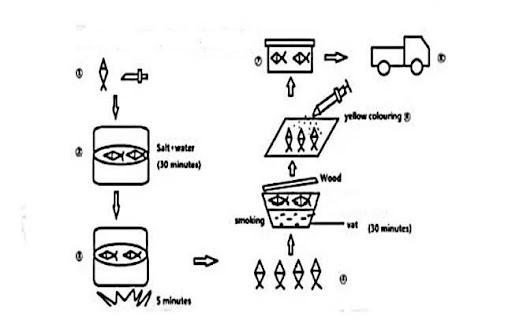
Soal IELTS Writing Task 1: The Small-Scale Production of Smoked Fish
The diagram shows the small-scale production of smoked fish. Summarise the information by selecting and reporting the main features, and make comparisons where relevant.
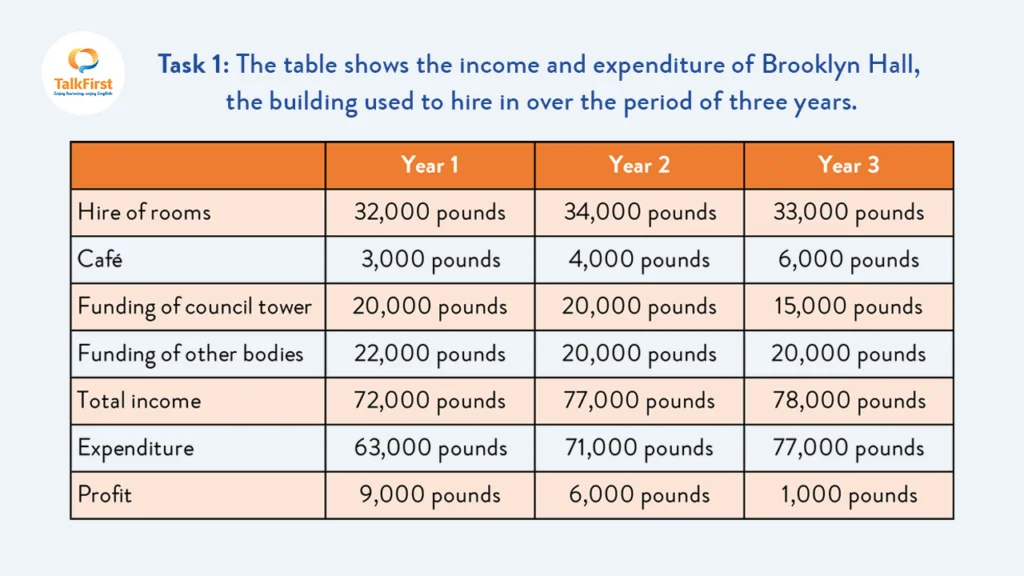
Soal IELTS Writing Task 1: The Income And Expenditure Of Brooklyn Hall
Summarise the information by selecting and reporting the main features, and make comparisons where relevant.
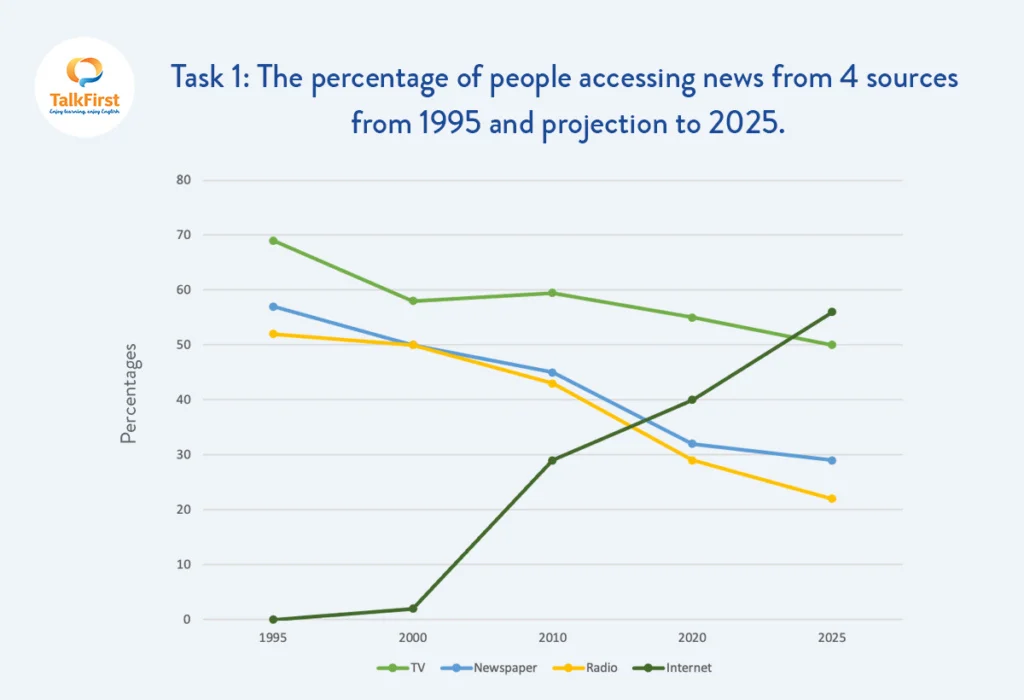
Soal IELTS Writing Task 1: Line Graph (The Percentage Of People Accessing News From 4 Sources: TV, Radio, Newspaper, Internet)
Summarise the information by selecting and reporting the main features, and make comparisons where relevant.
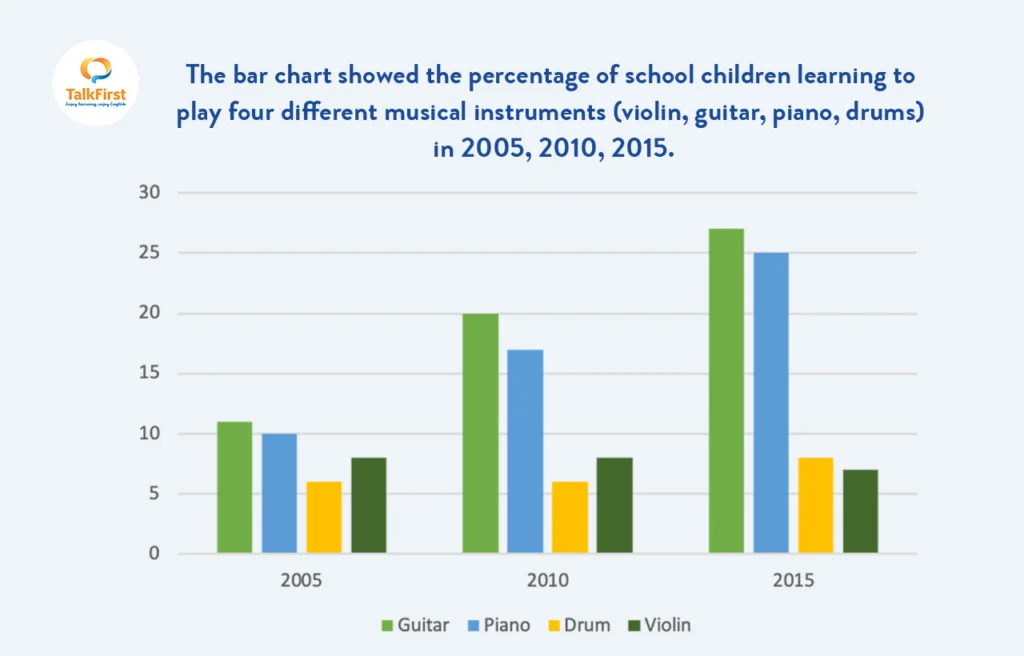
Soal IELTS Writing Task 1: The Percentage Of School Children
Summarise the information by selecting and reporting the main features, and make comparisons where relevant.
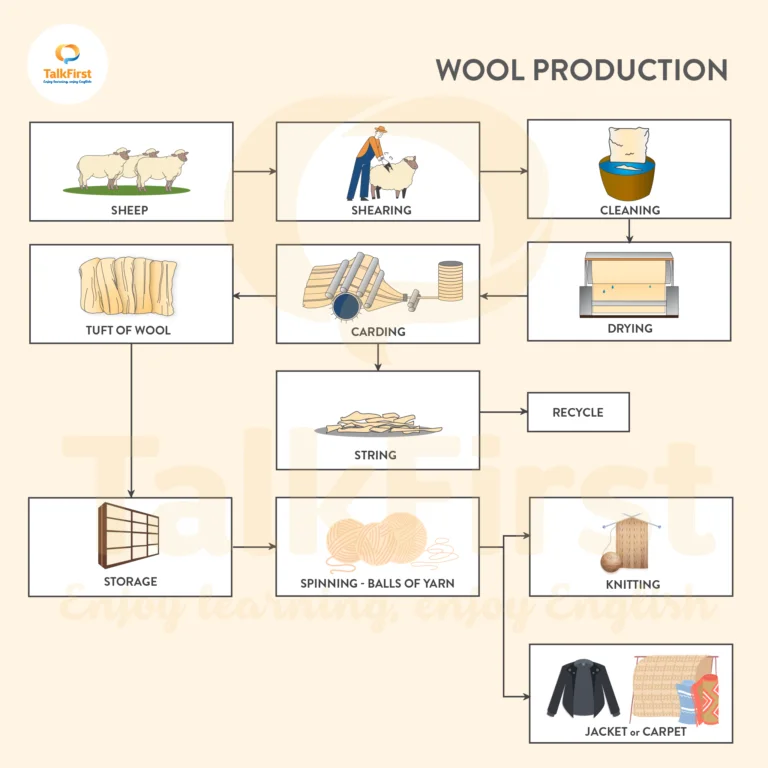
Soal IELTS Writing Task 1: The Process of Making Wool
The picture shows the process of making wool. Summarise the information by selecting and reporting the main features, and make comparisons where relevant.
Baca juga: Pertanyaan Umum Tentang IELTS Speaking
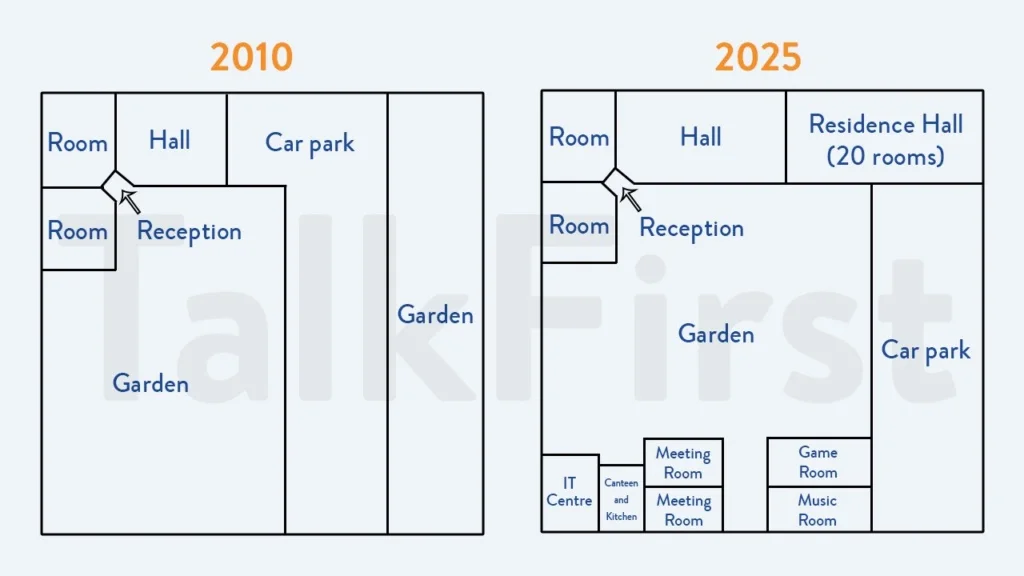
Soal IELTS Writing Task 1: The Difference in The Layout of The Conference Centre
The picture below shows the difference in the layout of the conference centre in 2010 and 2025. Summarise the information by selecting and reporting the main features, and make comparisons where relevant.
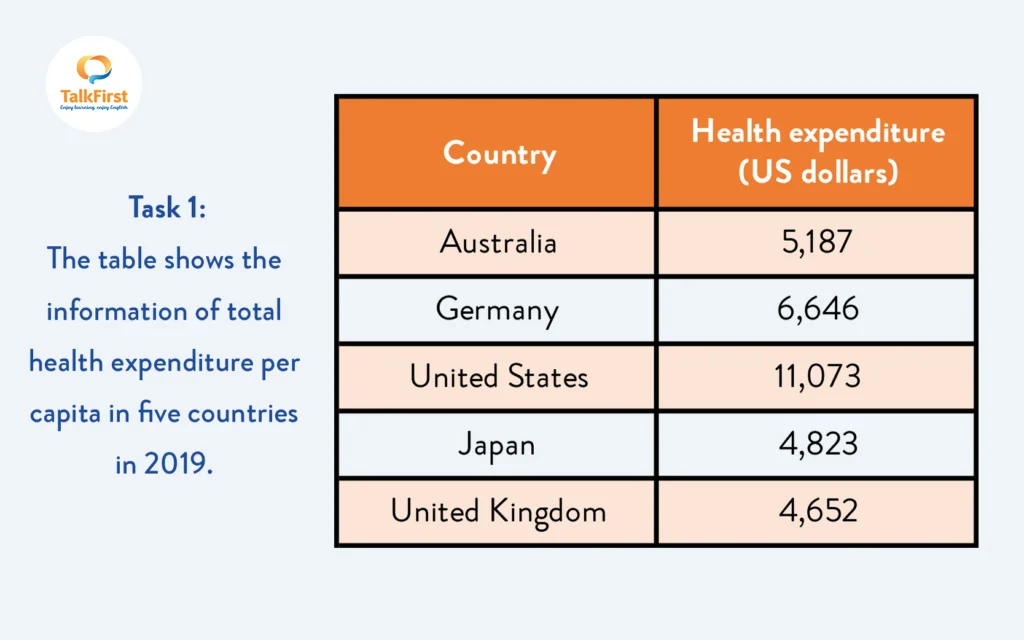
Soal IELTS Writing Task 1: Information Of Total Health Expenditure Per Capita
Summarise the information by selecting and reporting the main features, and make comparisons where relevant.
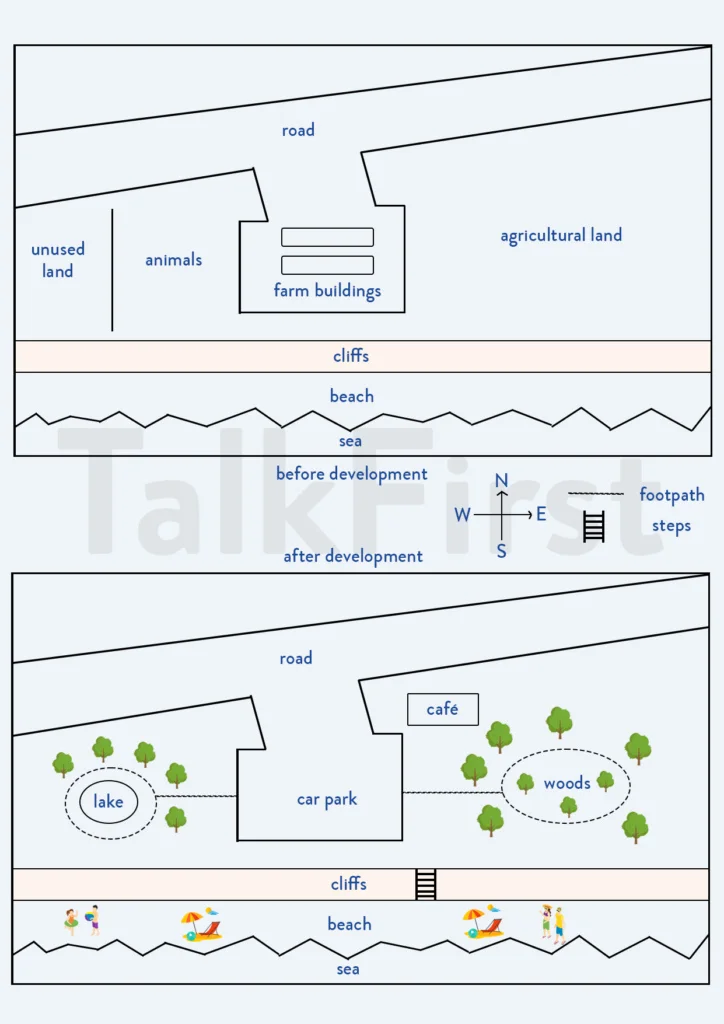
Soal IELTS Writing Task 1: Maps of The Coastal Land Develops to a Coastal Park
Summarise the information by selecting and reporting the main features, and make comparisons where relevant.
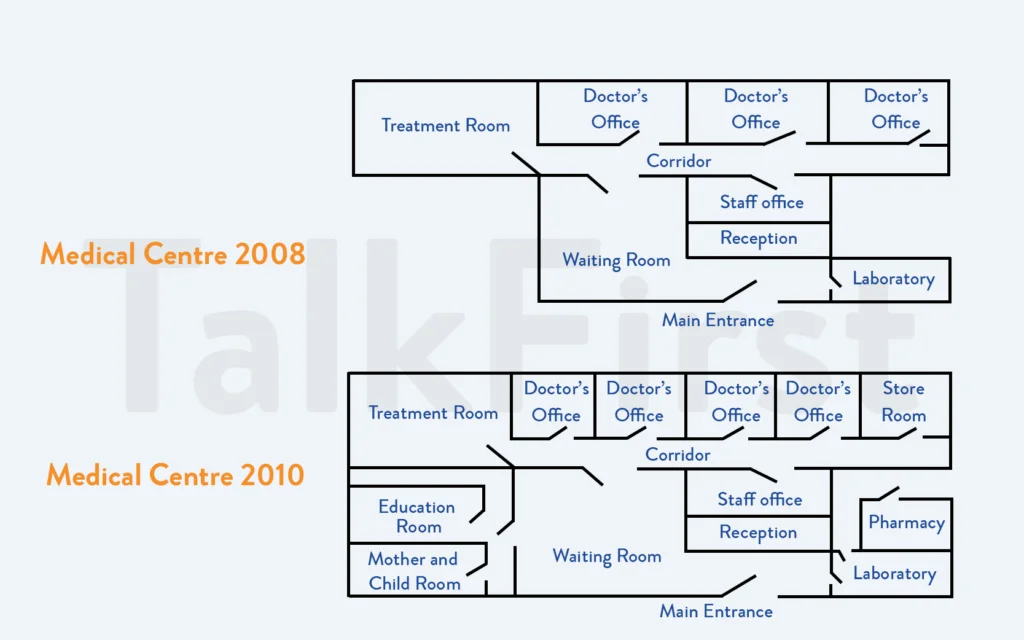
Soal IELTS Writing Task 1: Diagram The Plan of a Medical Centre
The diagram below shows the plan of a medical centre in 2008 and 2010. Summarise the information by selecting and reporting the main features, and make comparisons where relevant.
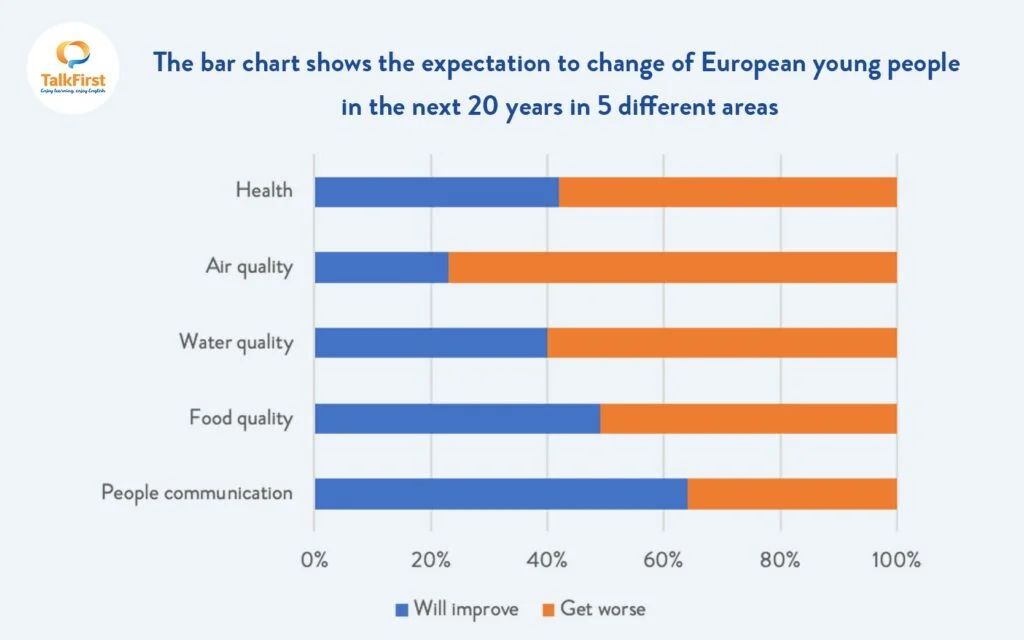
Soal IELTS Writing Task 1: The Expectation to Change of European
Summarise the information by selecting and reporting the main features, and make comparisons where relevant.
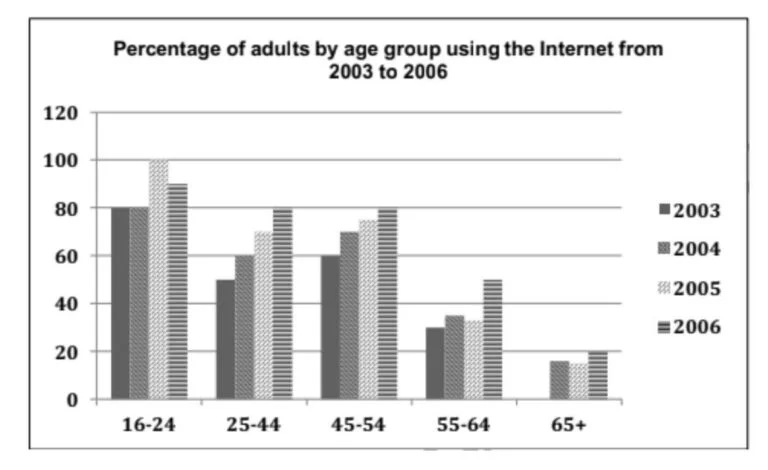
Soal IELTS Writing Task 1: Percentage of Adults of Different Age in The UK
The chart below shows the percentage of adults of different age in the UK who used the Internet everyday from 2003-2006. Summarise the information by selecting and reporting the main features, and make comparisons where relevant.
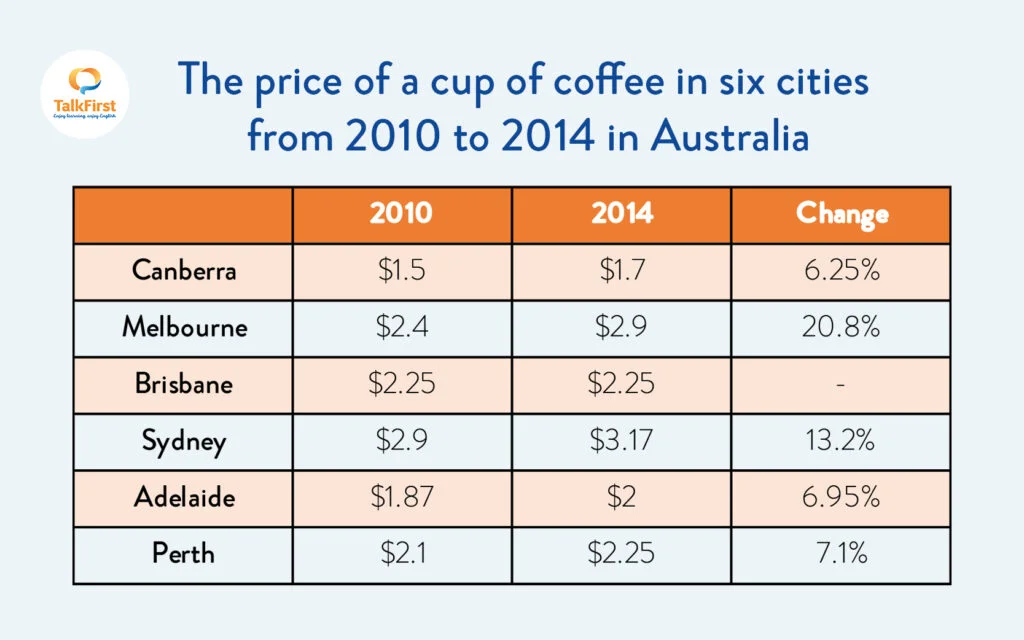
Soal IELTS Writing Task 1: The Price of a Cup of Coffee
Summarise the information by selecting and reporting the main features, and make comparisons where relevant.
Oke TNers! Itulah dia Kumpulan Soal IELTS Writing Terlengkap (Task 1) dari Minol. Jadi pastikan kalian mencatatnya dengan lengkap ya. Dan untuk kumpulan soal IELTS Writing terlengkap (Task 1) ini berlanjut lagi di artikel selanjutnya! Untuk lanjut ke kumpulan soal IELTS Writing Task 2, kamu bisa klik button di bawah ini:

